Crypto Gainers Price Prediction: WIF, SPX, XLM - Meme coins shine as Bitcoin hits record high
- Dogwifhat breaks out of a falling channel with a double-digit rise on Wednesday, eyes further gains.
- SPX’s triangle breakout rally is at a crucial crossroads near the $1.56 resistance.
- Stellar exits a triangle pattern, reaching a monthly high, and eyes an extended recovery.

Cryptocurrency market sentiment improves as Bitcoin (BTC) reaches a new all-time high, catalyzing a sharp recovery in meme coins such as Dogwifhat (WIF), SPX6900 (SPX), alongside the cross-border payment token Stellar (XLM). Altcoins WIF, SPX, and XLM outpace the broader crypto market with double-digit gains in the last 24 hours, while the technical outlook suggests enough fuel in the tanks to extend gains.
Bitcoin’s breakout from a falling channel pattern in the daily chart hits a new record high of $111,999. At the time of writing, BTC edges higher marginally, holding the gains from the previous day.
If the uptrend holds, Bitcoin could surpass the $112,000 mark this week.
The technical indicators, the Relative Strength Index (RSI) and Moving Average Convergence/Divergence (MACD), are above their neutral levels, suggesting a gradual rise in bullish momentum.
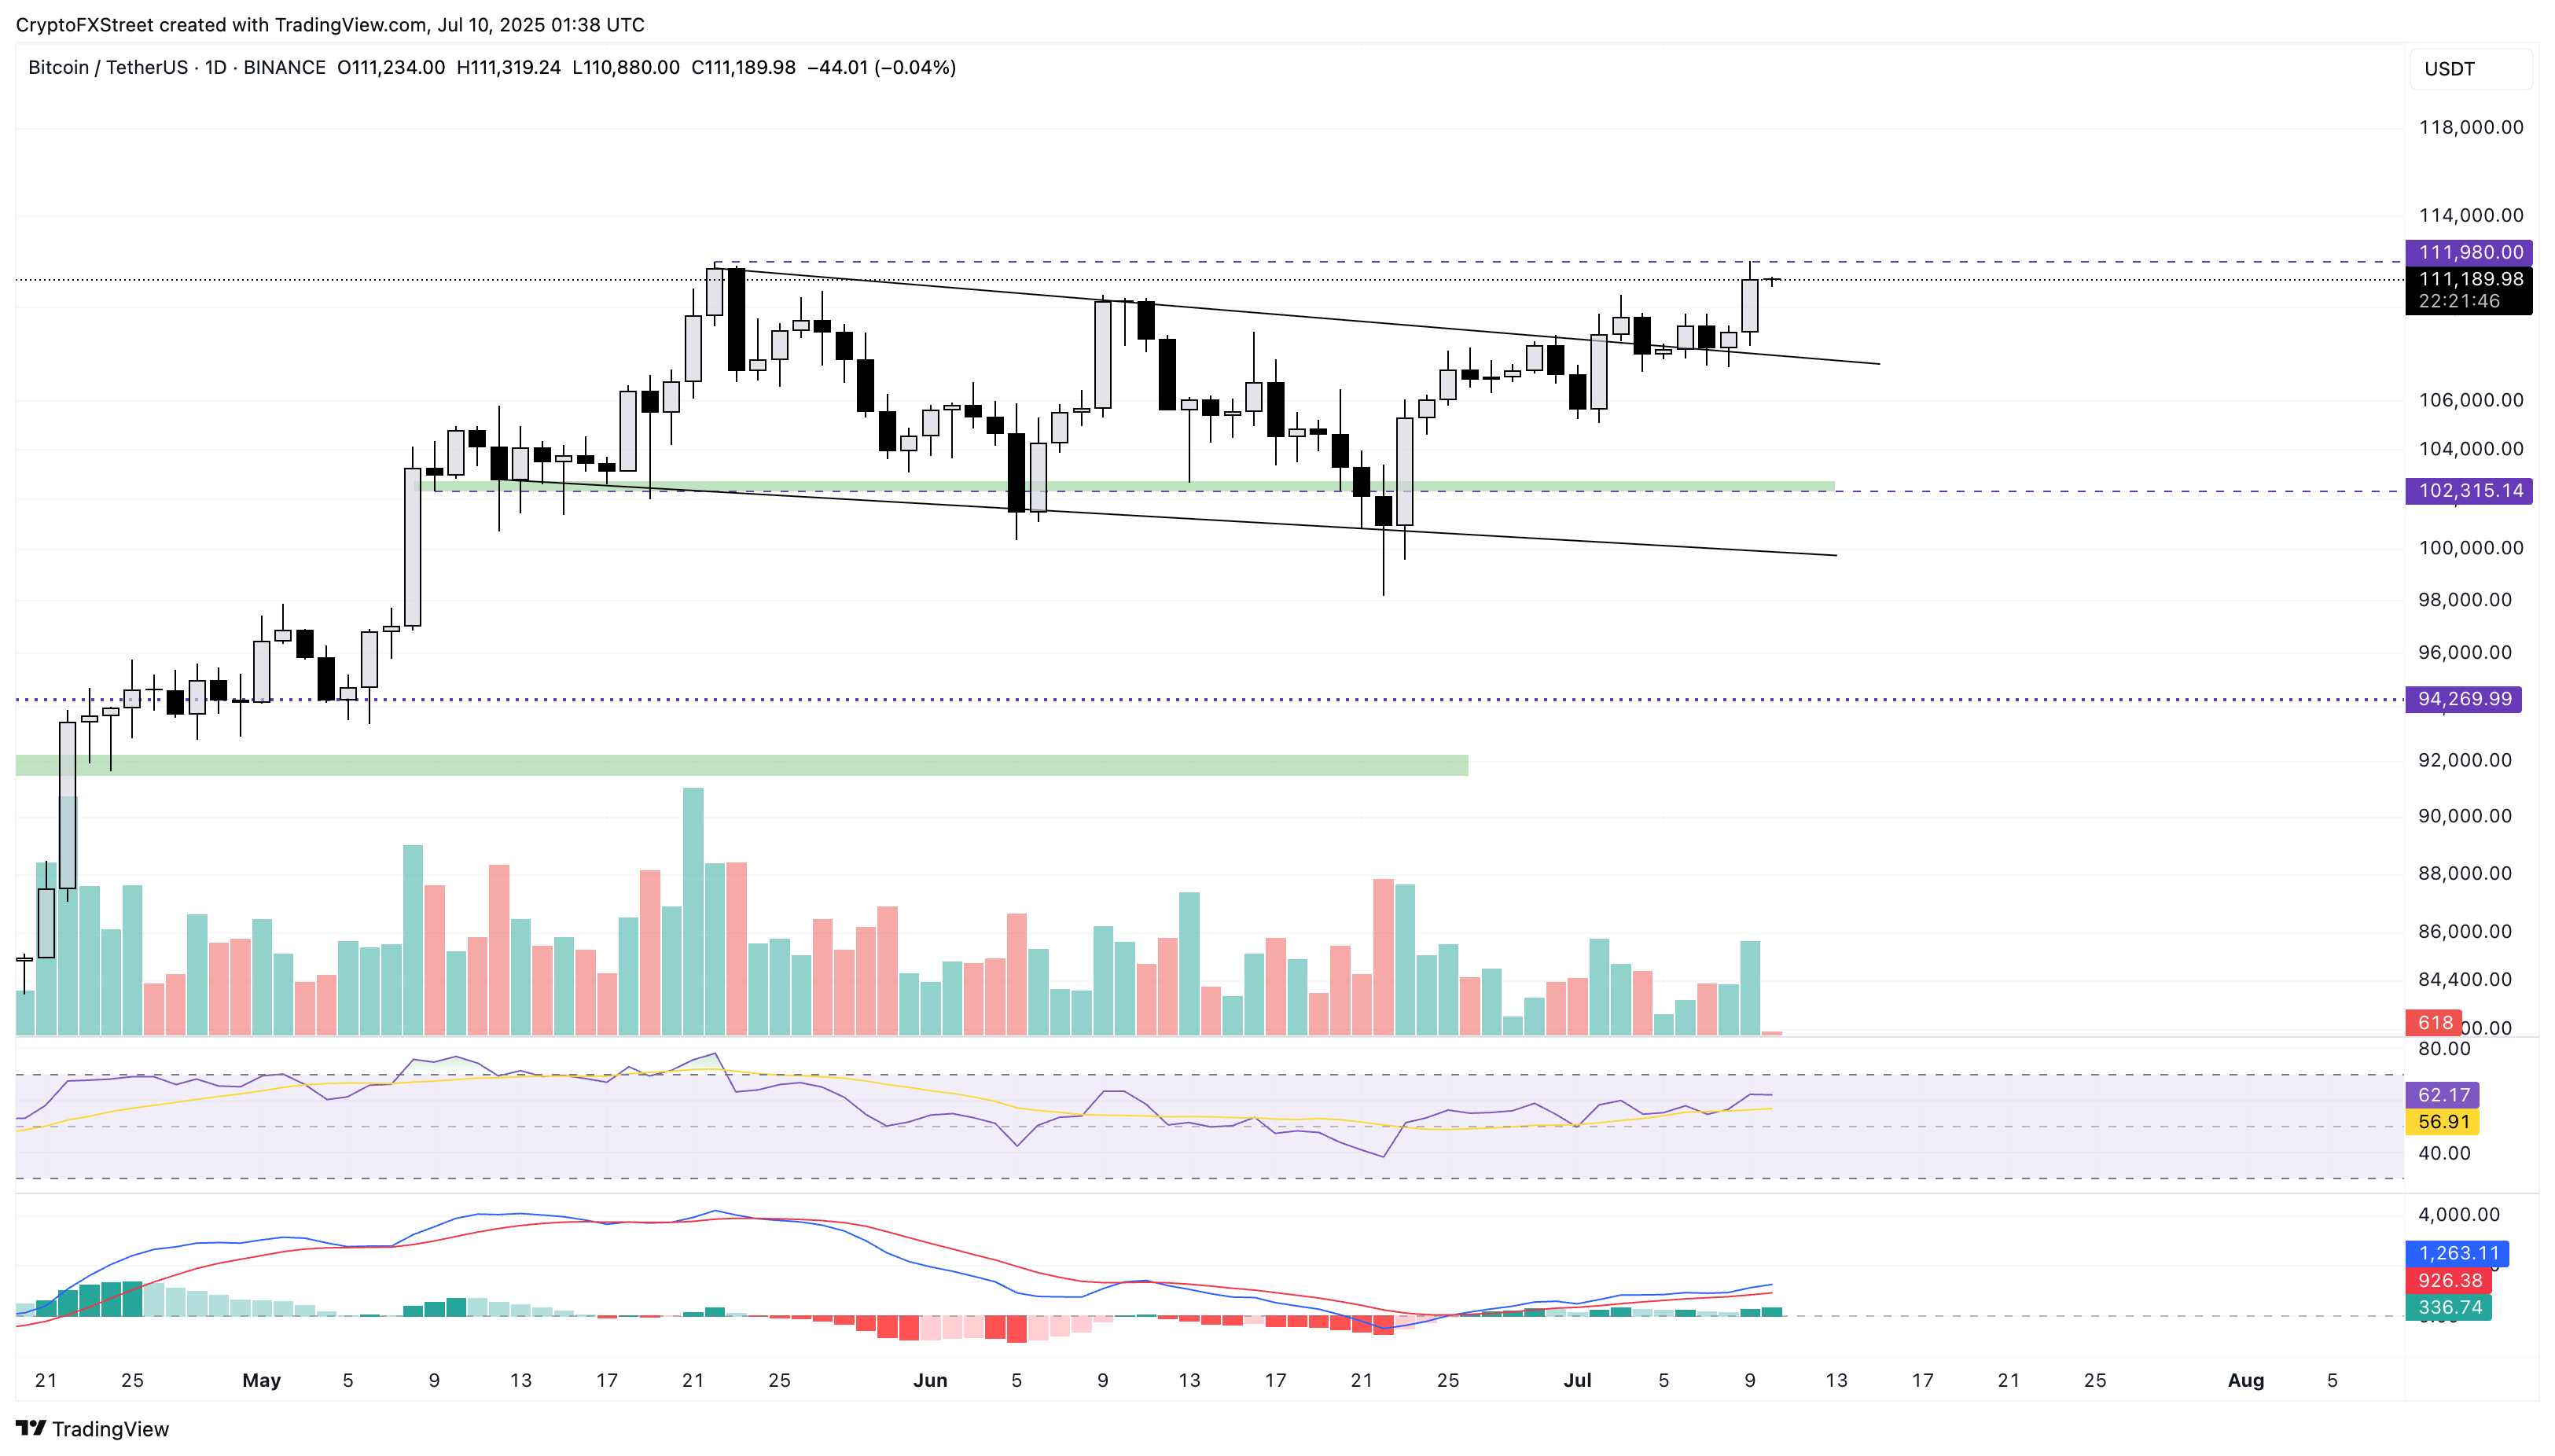
BTC/USDT daily price chart.
On the flip side, Bitcoin could test the $110,000 round figure, followed by the broken resistance trendline near $108,000.
Dogwifhat inches closer to $1
WIF forms a Doji candle at press time on Thursday, indicating a potential buffer phase following the 13% surge on Wednesday, resulting in a bullish engulfing candle. The sudden surge breaks out of a falling channel pattern as shown in the chart below.
The meme coin’s breakout rally targets the high of June 10 at $1.07 level, followed by the May 22 high of $1.20.
The technical indicators suggest a bullish tilt in trend momentum as the RSI at 58 hovers above the midpoint level while the MACD and signal line cross above the zero line.
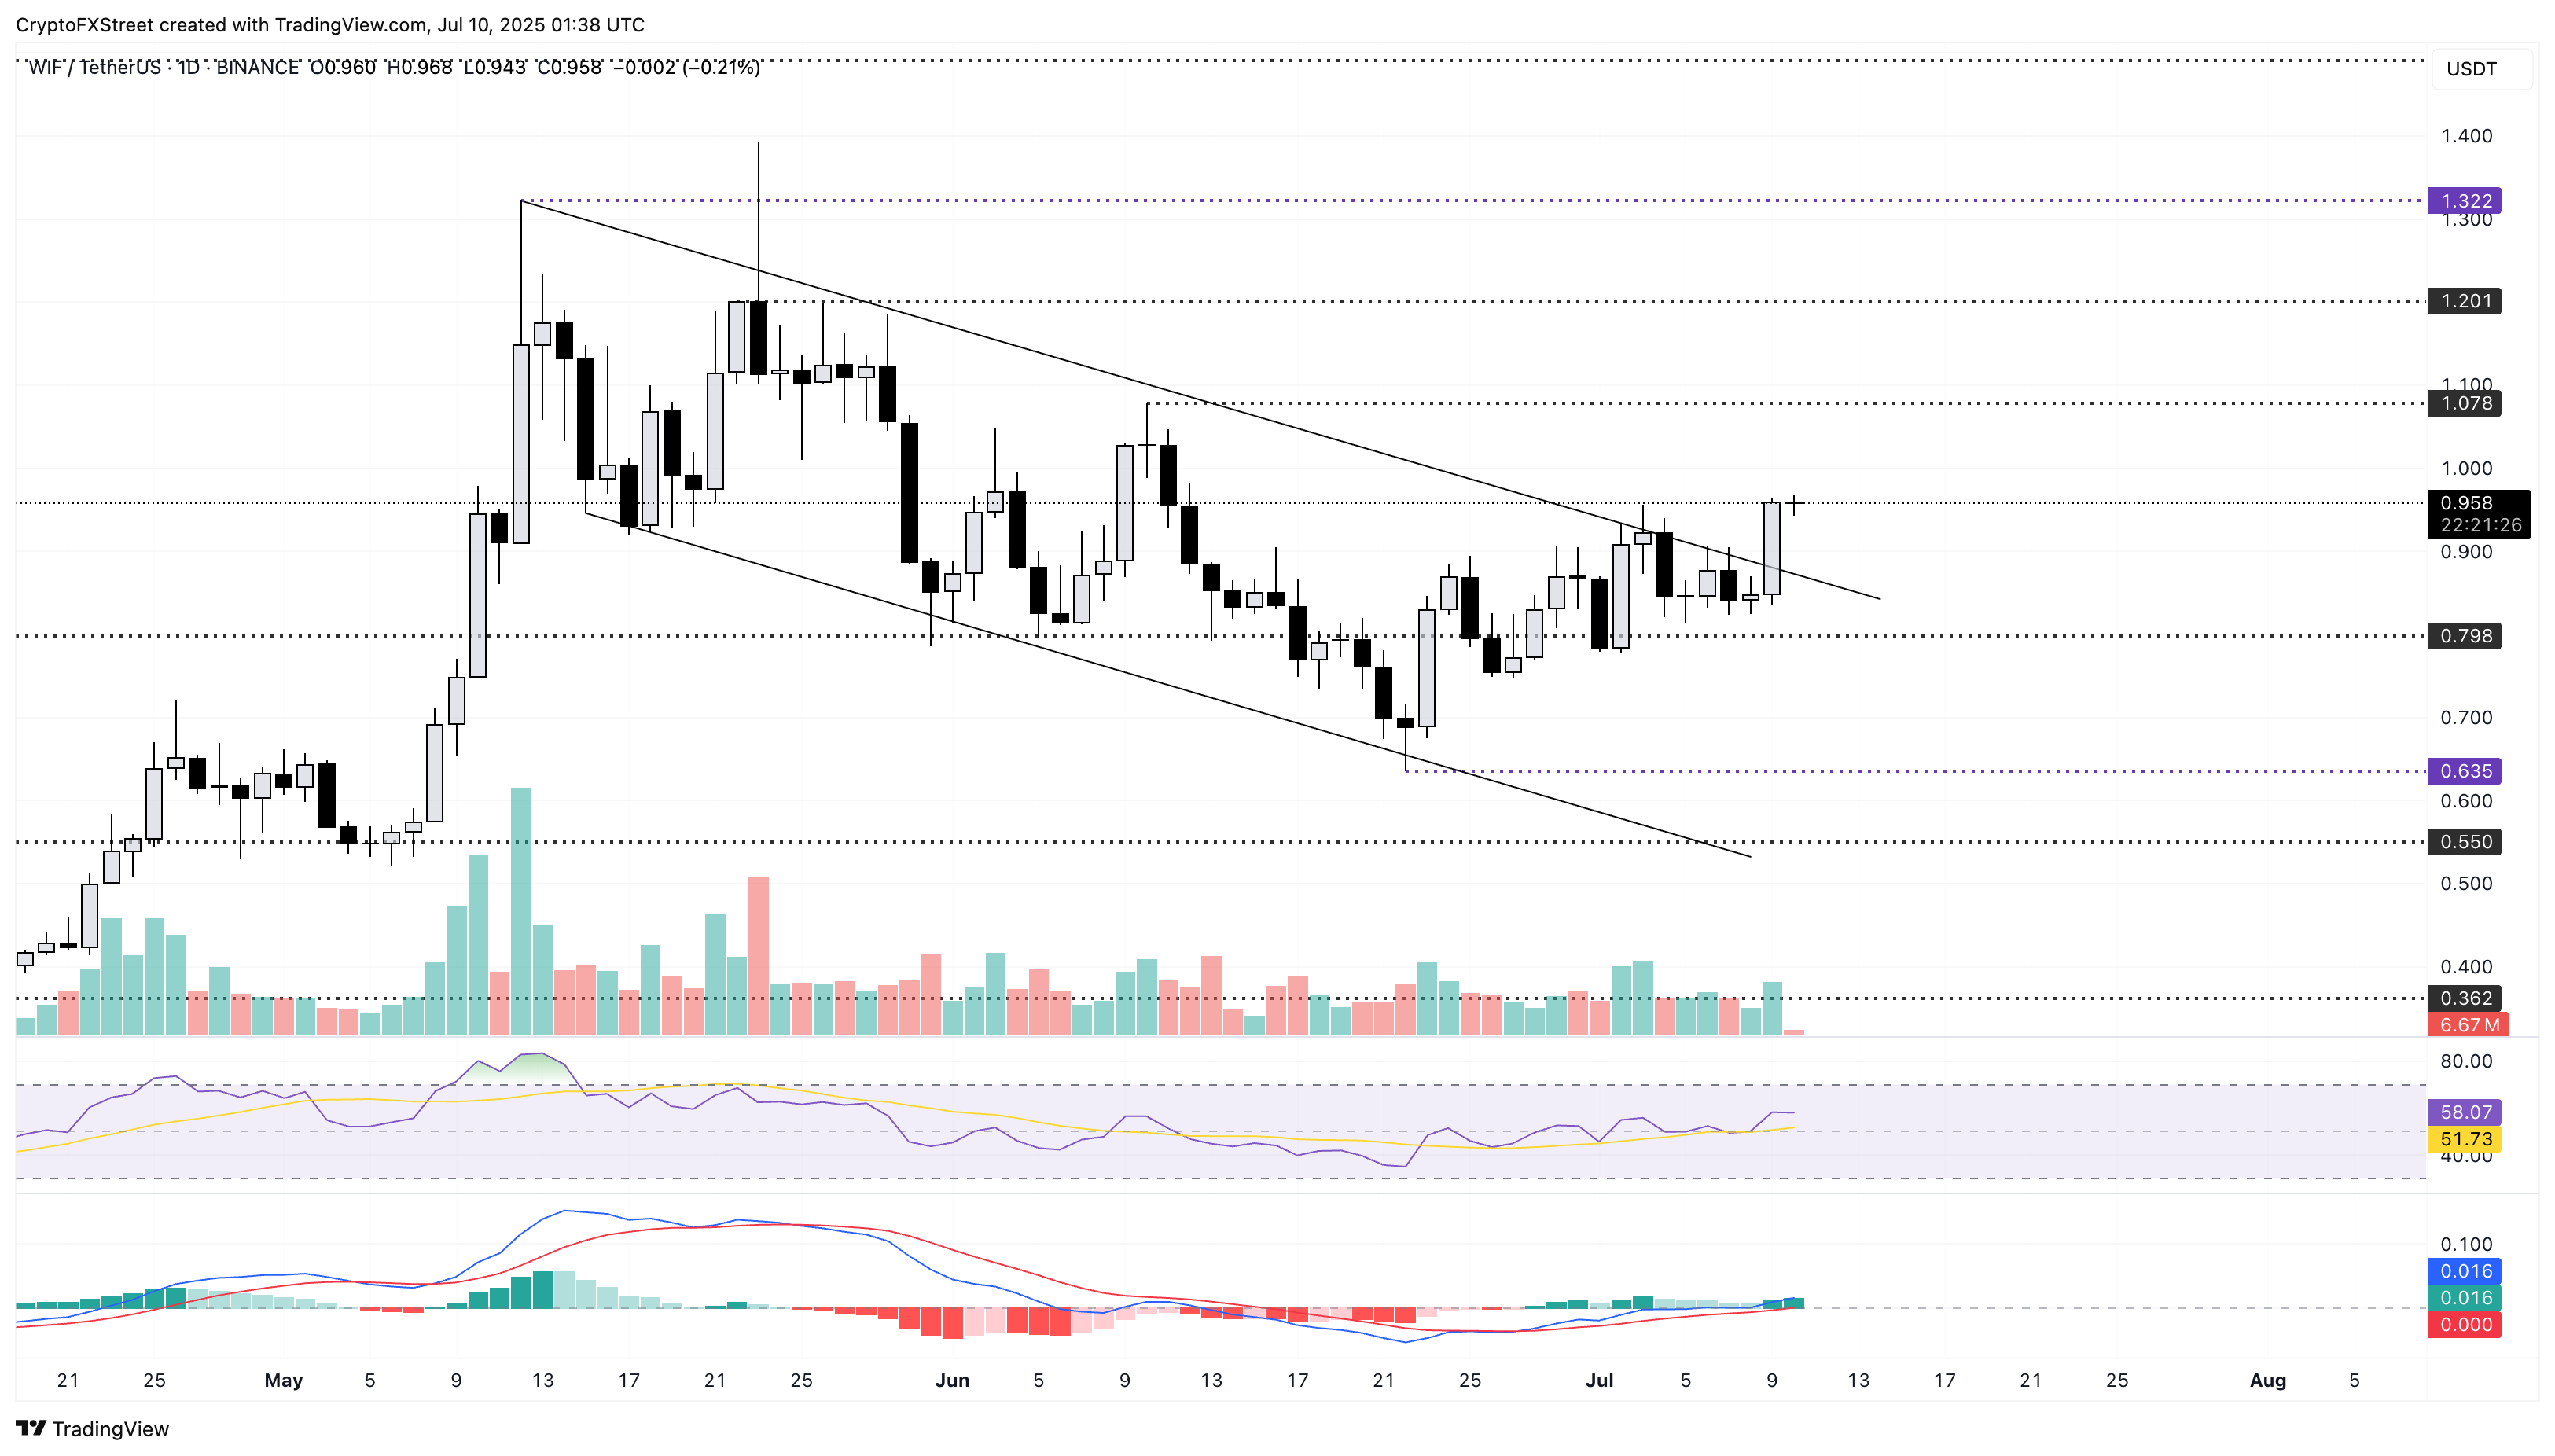
WIF/USDT daily price chart.
On the other hand, a sudden shift in WIF's trend could retest the broken trendline near $0.87.
SPX6900 eyes further gains as bullish momentum holds
SPX edges higher by over 1% on the day at press time, extending the gains from the ascending triangle breakout on the 4-hour chart, previously mentioned by FXStreet. The meme coin records a 9.47% surge on Wednesday, reaching the 78.6% Fibonacci retracement level at $1.5639, retraced between the $1.7407 high on June 11 and the $0.9146 low on June 21.
Sidelined investors could find a decisive daily close above $1.5639 as an entry opportunity. In such a case, the SPX rally could target $1.7407, the June 11 high.
The technical indicators on the 4-hour chart support the uptrend chances, as the RSI reads 72, entering the overbought region. Meanwhile, the MACD indicator displays rising green histogram bars, indicating an increase in trend momentum.
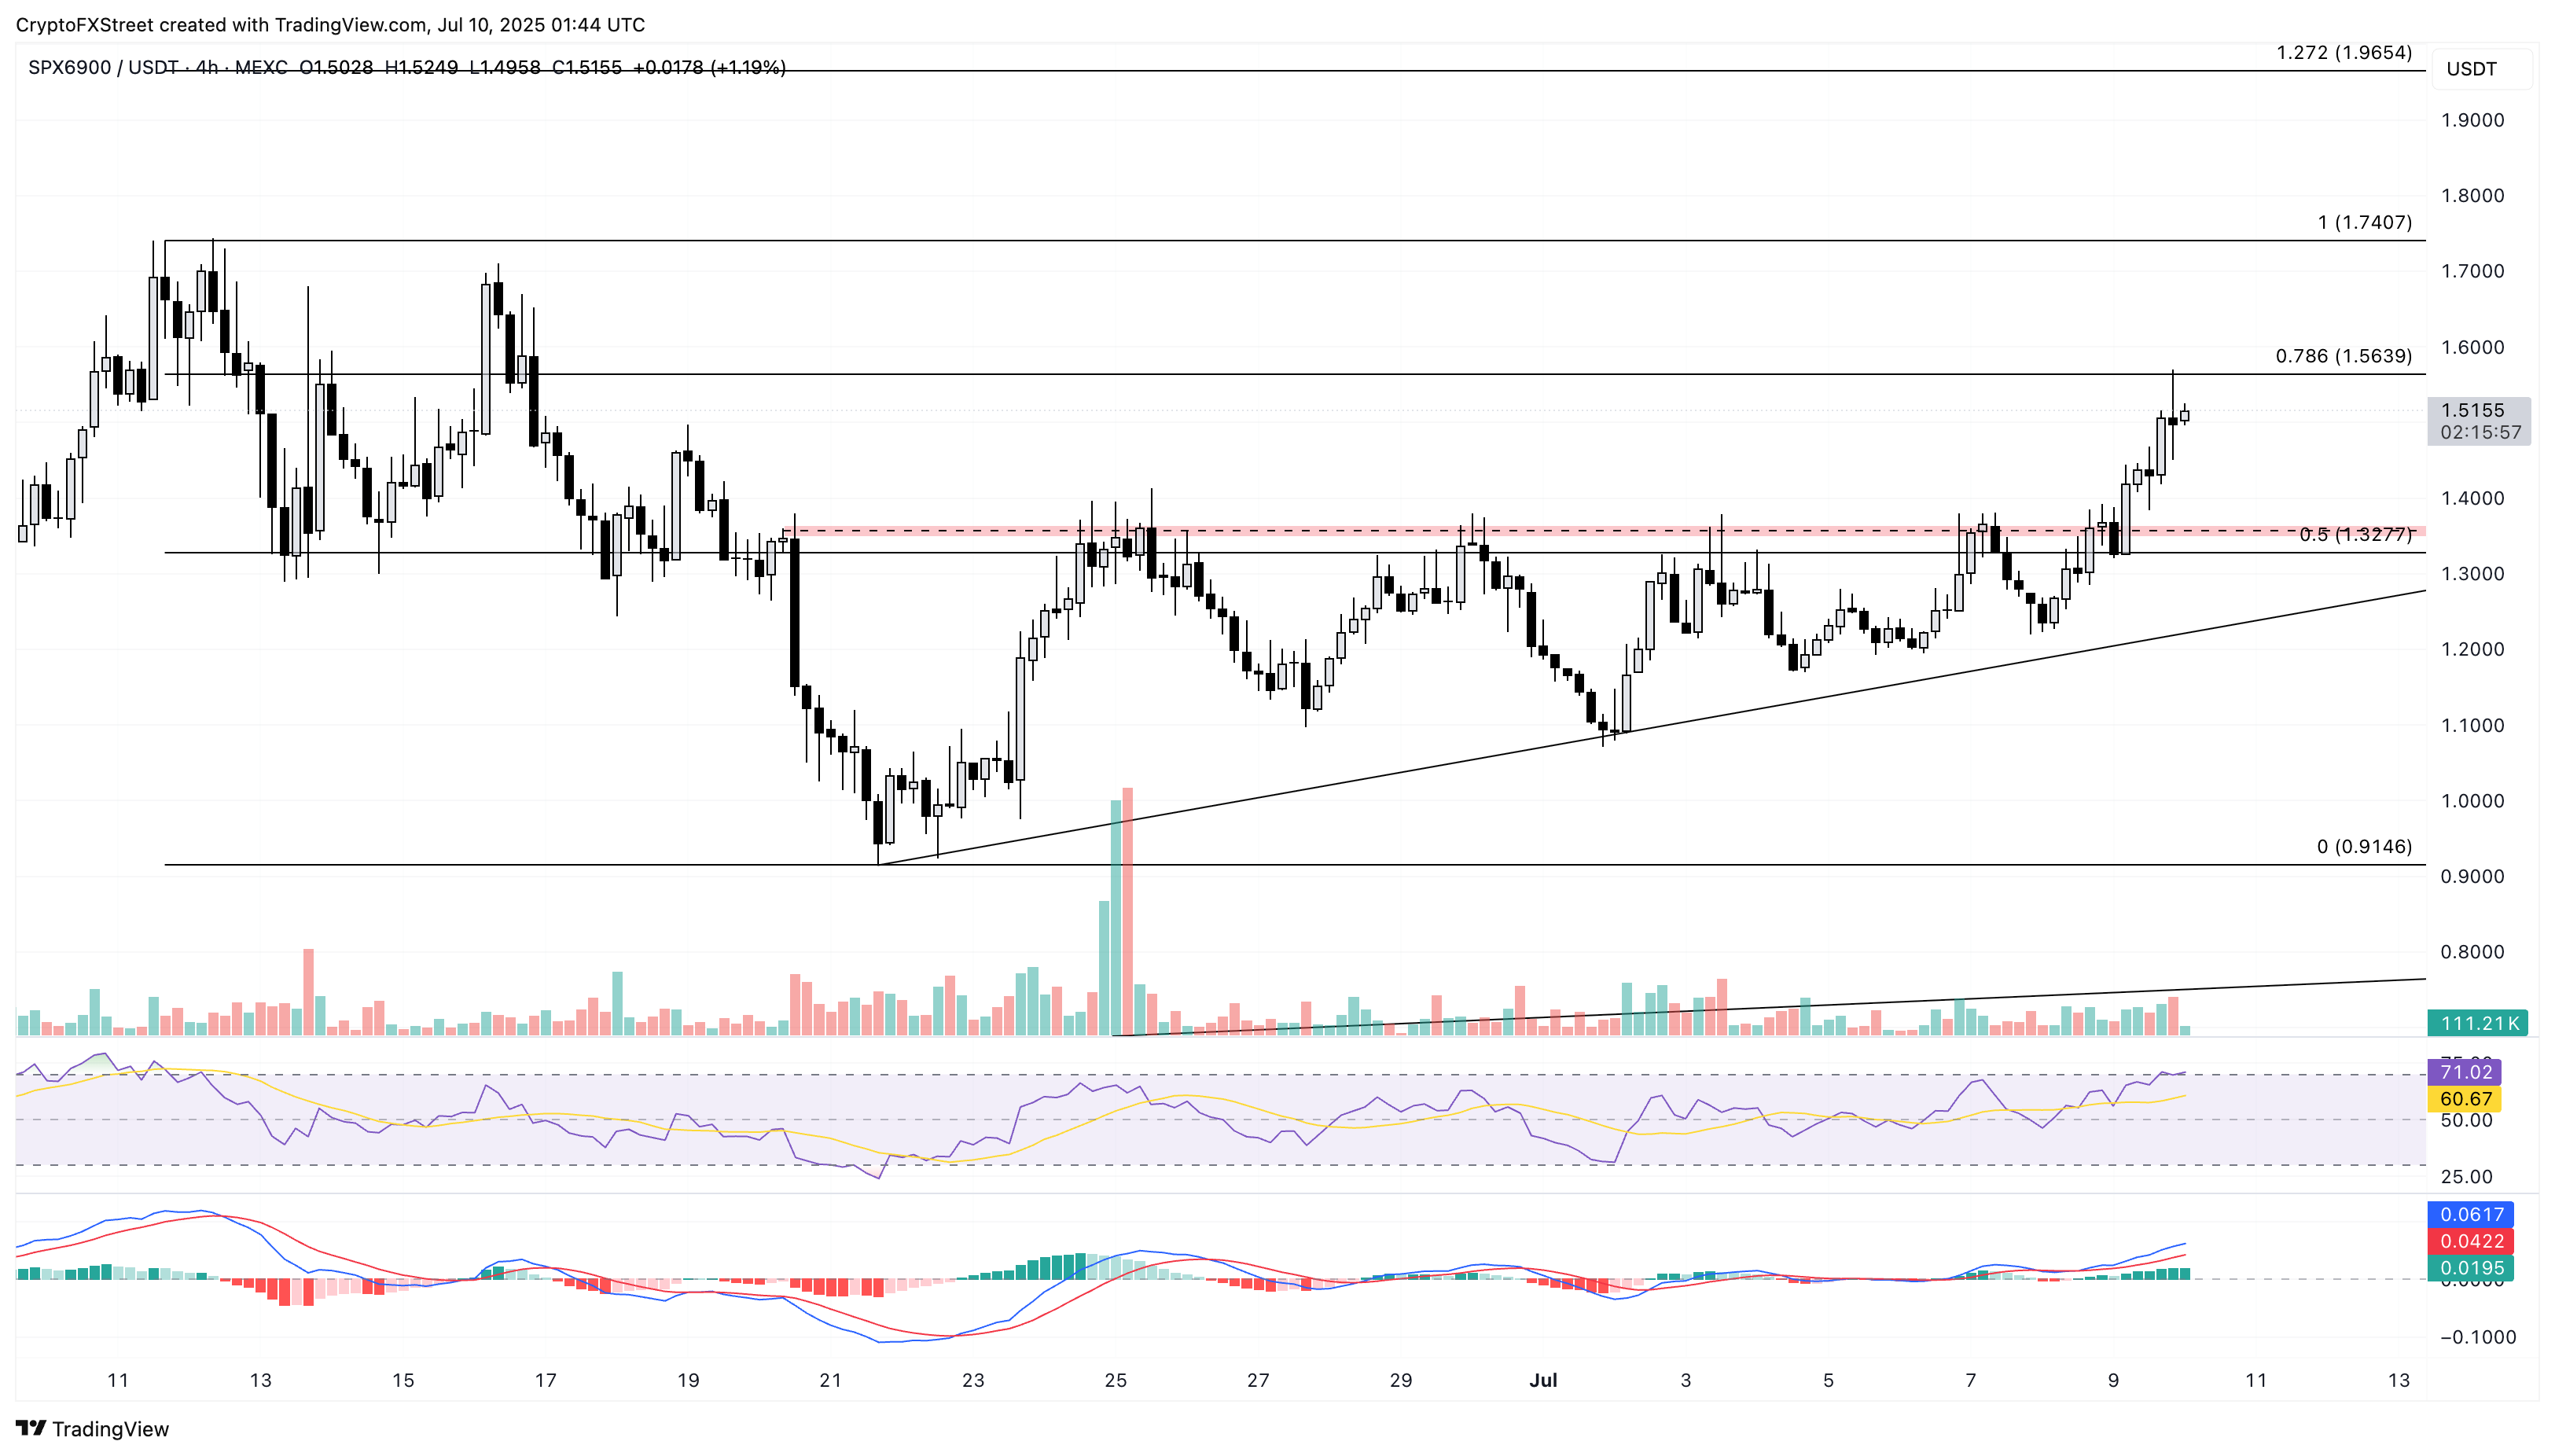
SPX/USDT daily price chart.
However, a reversal in SPX from the 78.6% Fibonacci level could retest the $1.35 supply zone.
Stellar’s triangle breakout signals a trend reversal
Stellar ticks higher by over 1% at press time on Thursday, printing its third consecutive positive candle. XLM’s reversal breaks a descending triangle pattern formed by the $0.22 support zone and the resistance trendline formed by connecting the peaks of December 3 and May 10.
The breakout rally exceeds the $0.28 resistance level marked by the high of June 11. A potential daily close above this level could extend the uptrend to the May 11 high of $0.32.
The technical indicators suggest a bullish bias, as the MACD indicator displays average lines crossing above the zero line, while the RSI, at 69, approaches the overbought zone.
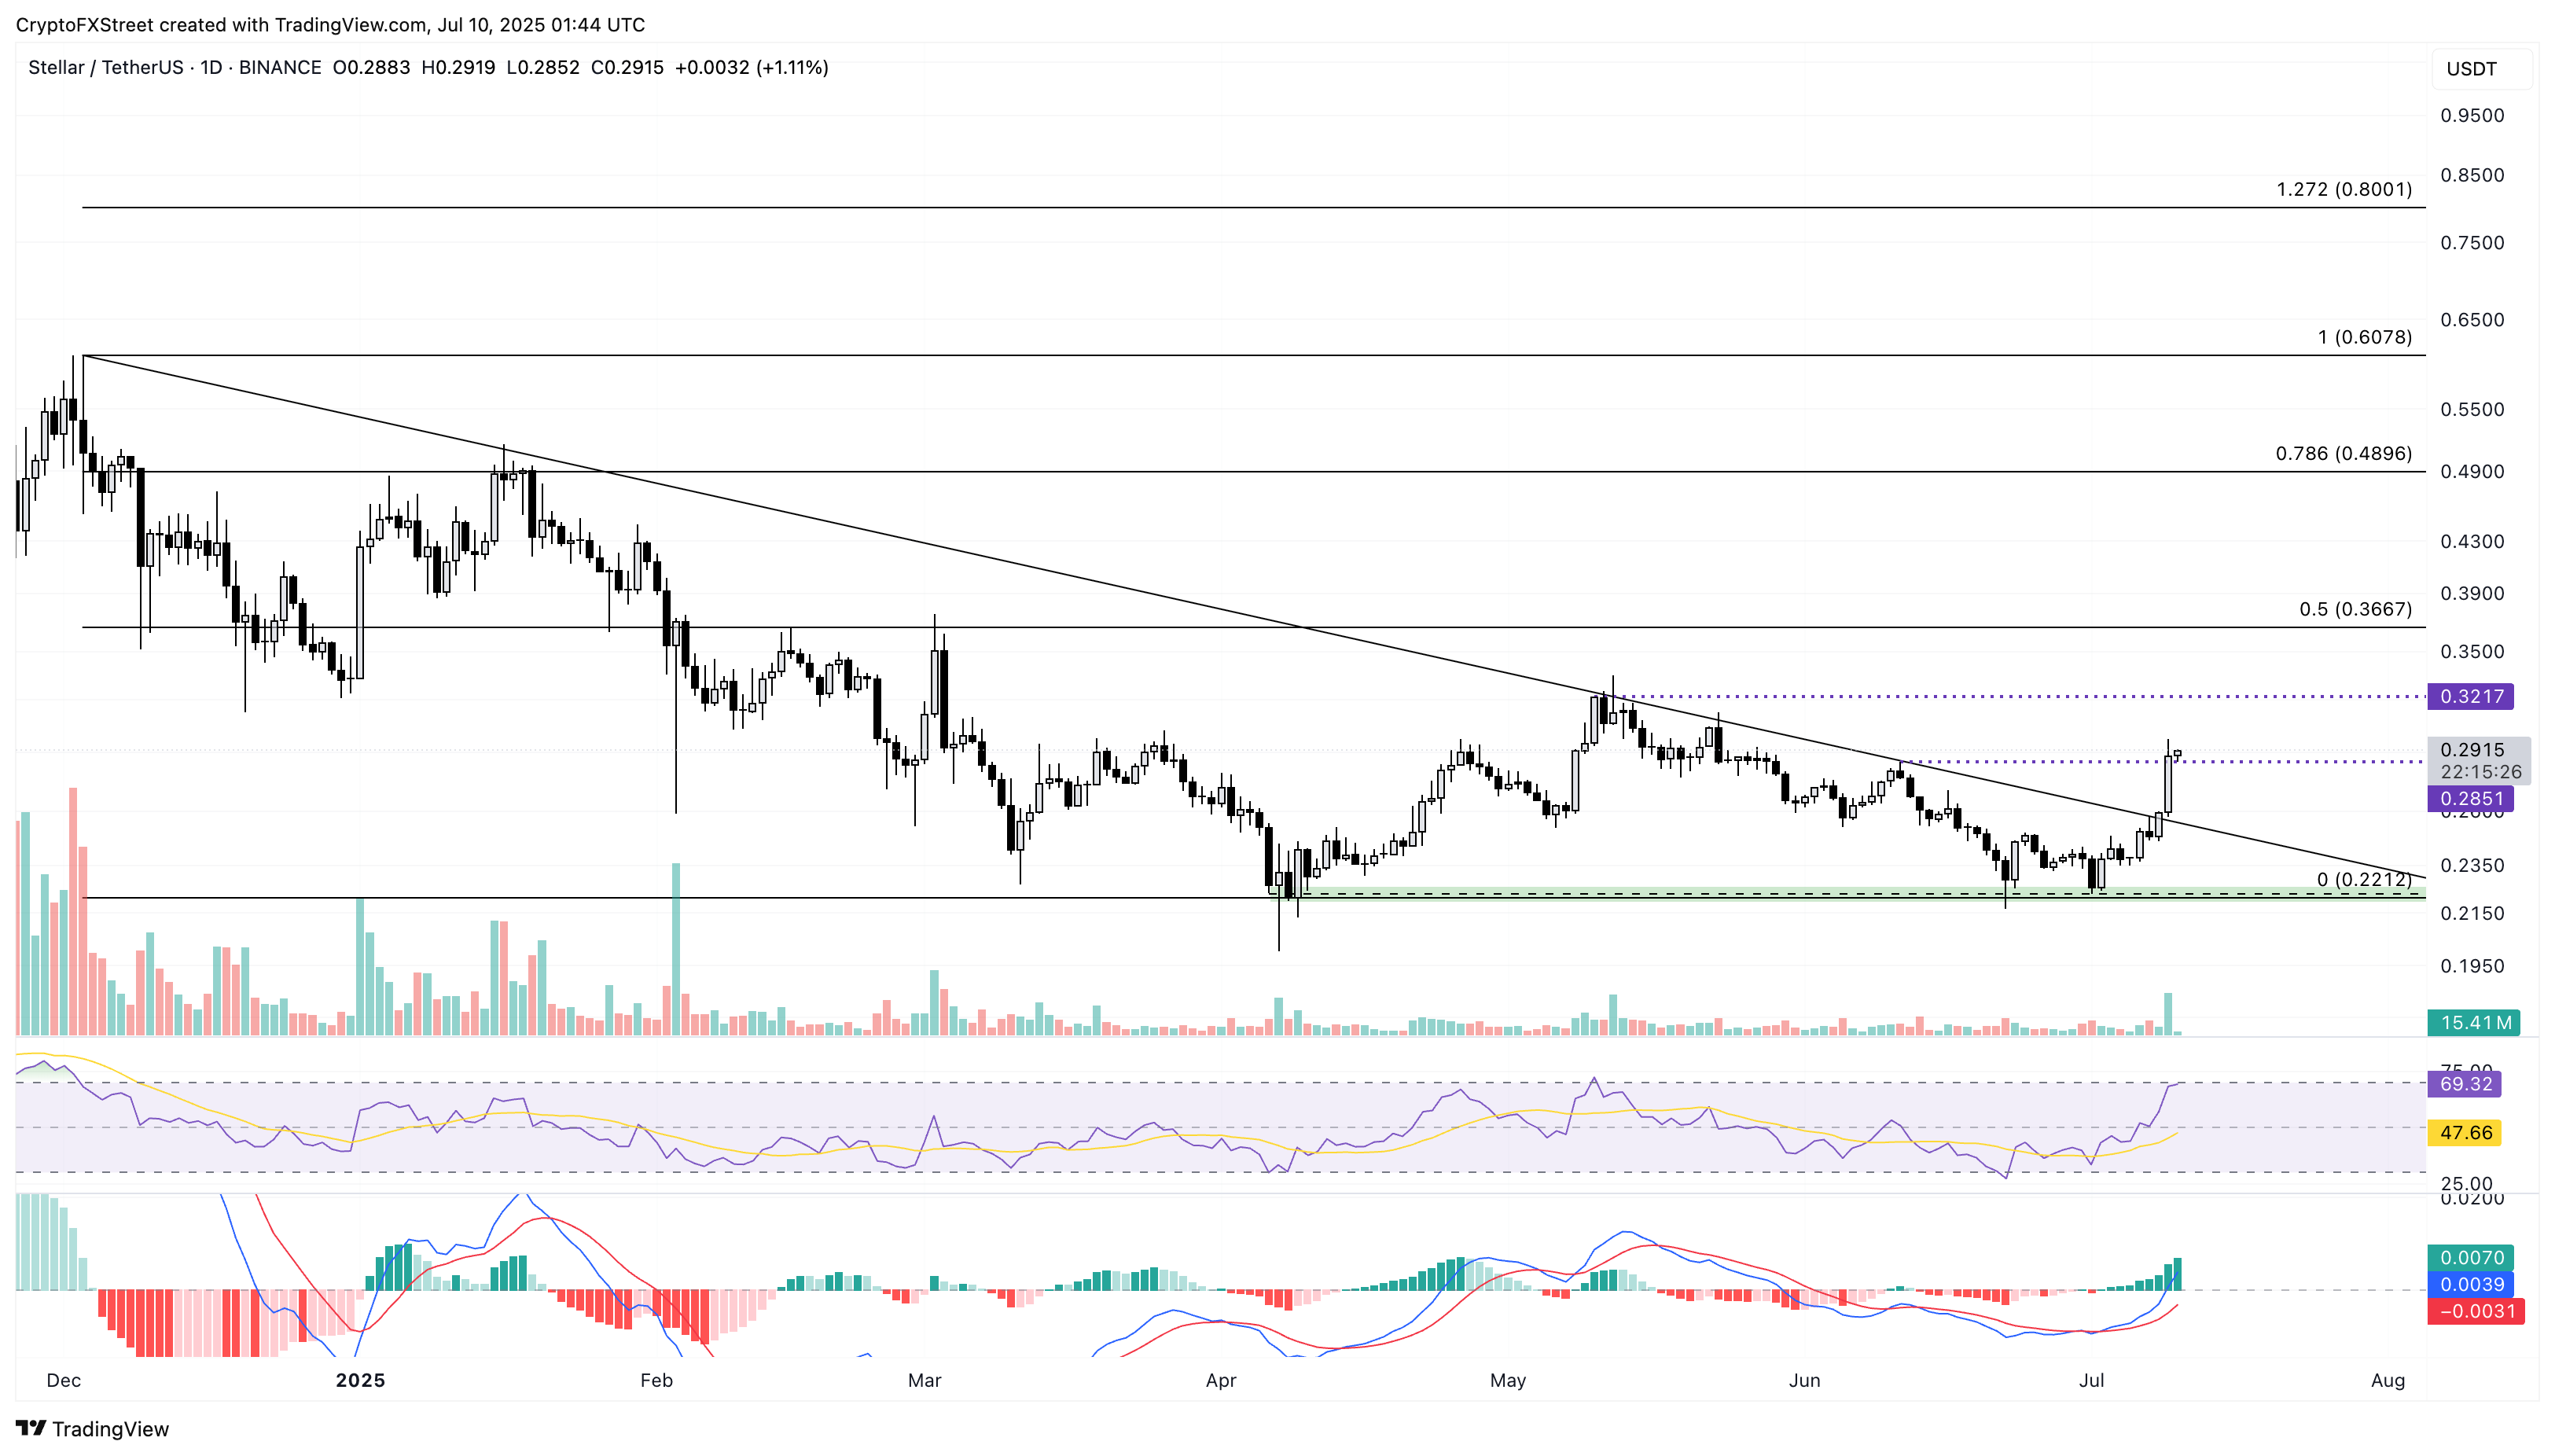
XLM/USDT daily price chart.
If the cross-border payment token fails to hold above $0.28, it could reverse towards the broken trendline at $0.25, erasing the gains made on Wednesday.
Author

Vishal Dixit
FXStreet
Vishal Dixit holds a B.Sc. in Chemistry from Wilson College but found his true calling in the world of crypto.


