|

Neo Market Update: NEO charts yearly highs, as it readies for DeFi

  • The new Neo update increases the overall block size limit and improves overall network health.
  • The 4-hour NEO chart has formed the head and shoulders pattern. 

Neo issues new mainnet update

The Neo Global Development (NGD) has announced a new version of the core Neo2 node client, neo-cli v2.12.0. This update increases the overall block size limit and improves overall network health. The GAS limit has gone up from 10 to 50, while the max number of transactions per block has dropped from 500 to 200.

This increase in gas limit is for Neo’s upcoming DeFiFlamingo. The new updates will ensure network stability by compensating for an expected increase in contract execution time.

NEO/USD daily chart

NEO/USD daily chart

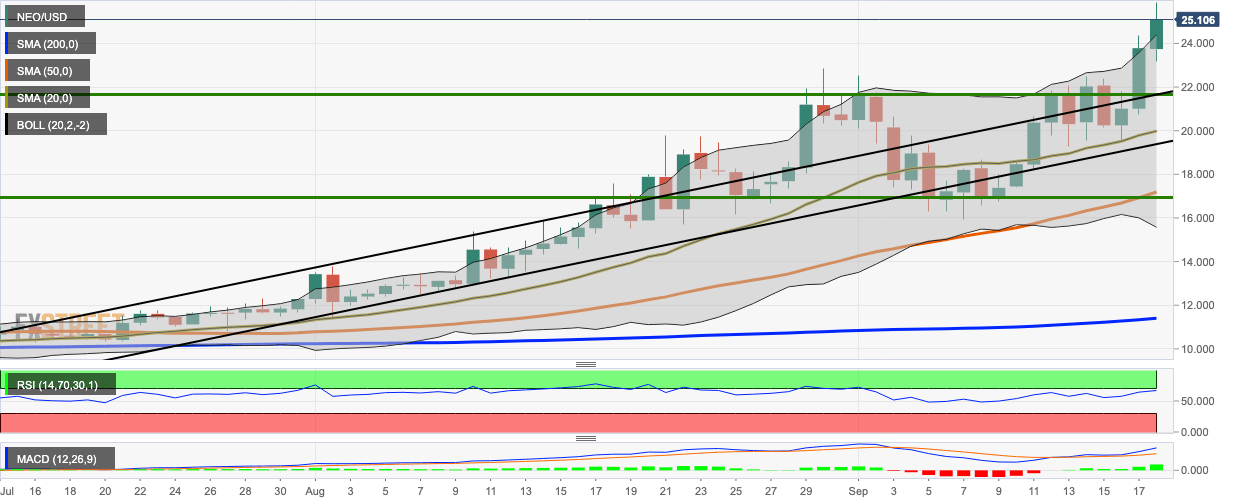
NEO buyers have stayed in control for three straight days, charting the three green soldiers pattern as it went up from $20.35 to $25.15. The price reached intraday highs of $25.90, charting a 52-week high. In the process, the price has crossed the upper curve of the 20-day Bollinger Band and the relative strength index has crept into the overbought zone. Both these indicators show that the price is presently overvalued and will face bearish correction soon. The immediate target for correction will be $24.50, bringing the price back inside the 20-day Bollinger Band.

NEO/USD 4-hour chart

NEO/USD 4-hour chart

The 4-hour chart has formed the head and shoulders pattern and then broke above the upward trending line. The RSI is hovering along the very edge of the overbought zone, prompting a bearish correction, as the two latest candlesticks have formed a bearish engulfing pattern.

NEO on-chain dev activity

fxsoriginal

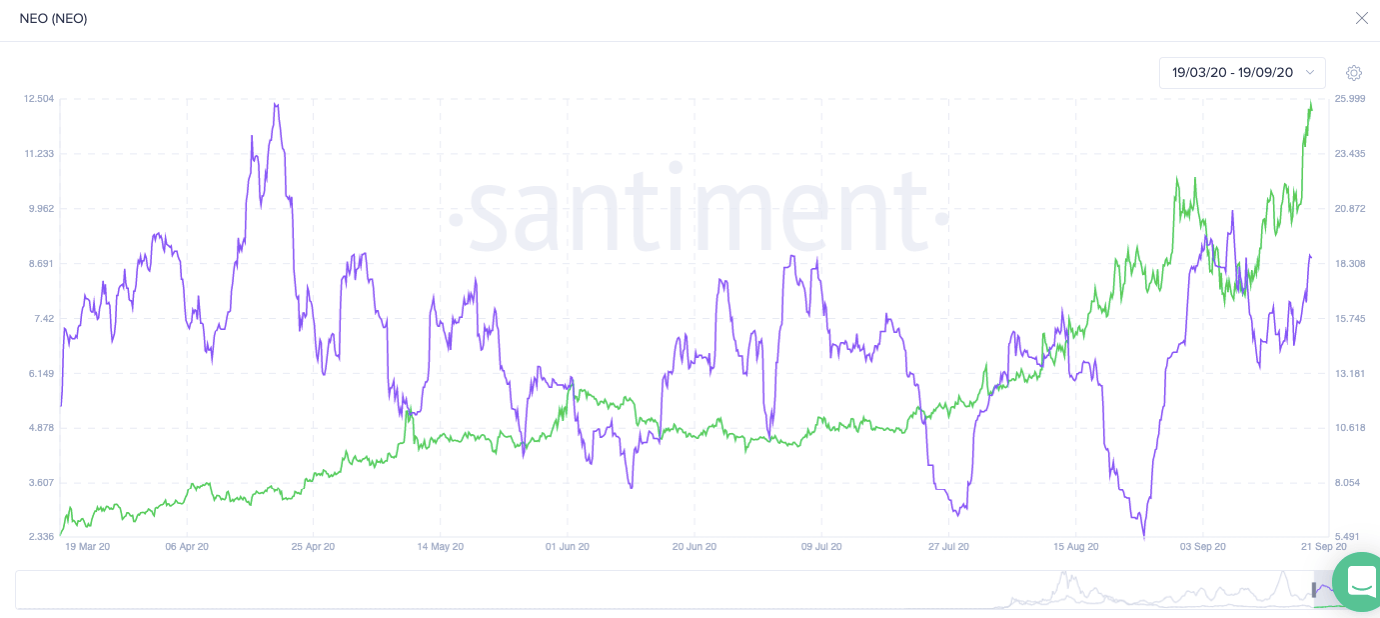
As per Santiment, the dev activity has recently increased due to the upcoming Flamingo. As expected, the price has reacted very positively to this increased dev activity. 

Key levels

NEO/USD

Overview
Today last price25.097
Today Daily Change1.31300
Today Daily Change %5.52
Today daily open23.784
 
Trends
Daily SMA2019.7868
Daily SMA5016.9259
Daily SMA10013.81543
Daily SMA20011.33486
 
Levels
Previous Daily High24.378
Previous Daily Low20.728
Previous Weekly High20.636
Previous Weekly Low15.932
Previous Monthly High22.871
Previous Monthly Low11.454
Daily Fibonacci 38.2%22.9837
Daily Fibonacci 61.8%22.1223
Daily Pivot Point S121.54867
Daily Pivot Point S219.31333
Daily Pivot Point S317.89867
Daily Pivot Point R125.19867
Daily Pivot Point R226.61333
Daily Pivot Point R328.84867

Author

Rajarshi Mitra

Rajarshi Mitra

Independent Analyst

Rajarshi entered the blockchain space in 2016. He is a blockchain researcher who has worked for Blockgeeks and has done research work for several ICOs. He gets regularly invited to give talks on the blockchain technology and cryptocurrencies.

More from Rajarshi Mitra
Share:

Editor's Picks

Ripple Price Forecast: XRP potential bottom could be in sight

Ripple edges up above the intraday low of $1.35 at the time of writing on Friday amid mixed price actions across the crypto market. The remittance token failed to hold support at $1.40 the previous day, reflecting risk-off sentiment amid a decline in retail and institutional sentiment. 

Crypto Today: Bitcoin, Ethereum, XRP in choppy price action, weighed down by falling institutional interest 

Bitcoin holds above support at $65,118 at the time of writing on Friday. Ethereum remains choppy in a narrow range between support at $1,900 and resistance at $2,000, while Ripple attempts another upward move toward the pivotal $1.40 level.

PancakeSwap Price Analysis: Bearish momentum suggests further downside

PancakeSwap (CAKE) is trading below $1.26 at the time of writing on Friday, extending the losses by over 8% so far this week. The weakening derivatives market further supports the bearish outlook, with bears aiming for levels below $1.18.

Decred Price Forecast: DCR rebounds toward key resistance zone on volume spike

Decred (DCR) rebounds over 7% at press time on Friday after a three-day decline of almost 14%. Roughly 60% increase in trading volume over the last 24 hours supports the recovery, suggesting heightened spot-market demand. 

Bitcoin Price Annual Forecast: BTC holds long-term bullish structure heading into 2026

Bitcoin (BTC) is wrapping up 2025 as one of its most eventful years, defined by unprecedented institutional participation, major regulatory developments, and extreme price volatility.

Bitcoin: BTC bears aren’t done yet

Bitcoin (BTC) price slips below $67,000 at the time of writing on Friday, remaining under pressure and extending losses of nearly 5% so far this week.