Compound Price Prediction: COMP strong buy signal could push it towards $170
- COMP is currently trading at $152 and has established a double bottom.
- The digital asset is down 44% since its all-time high at $276.5.

Compound was one of the most successful DeFi projects to hit the market, jumping towards $1 billion in market capitalization just days after getting listed. Compound is still ranked 41st, and bulls are looking for a clear breakout to the upside.
COMP/USD 12-hour chart
-637359490642992172.png)
On the 12-hour chart, the TD sequential created a strong buy signal right after COMP price managed to defend $145, a support level established on September 6. The price formed a clear double bottom, which is also considered bullish. Similarly, the RSI has also defended the same level.
-637359494751236856.png)
IOMAP Chart
Not only that, but the Bollinger Bands are getting squeezed significantly, indicating that a big move might happen soon. Unfortunately, the IOMAP chart shows little support between $151 and $140, which means that a bearish breakout would be devastating for COMP and could bring the digital asset down to $110.
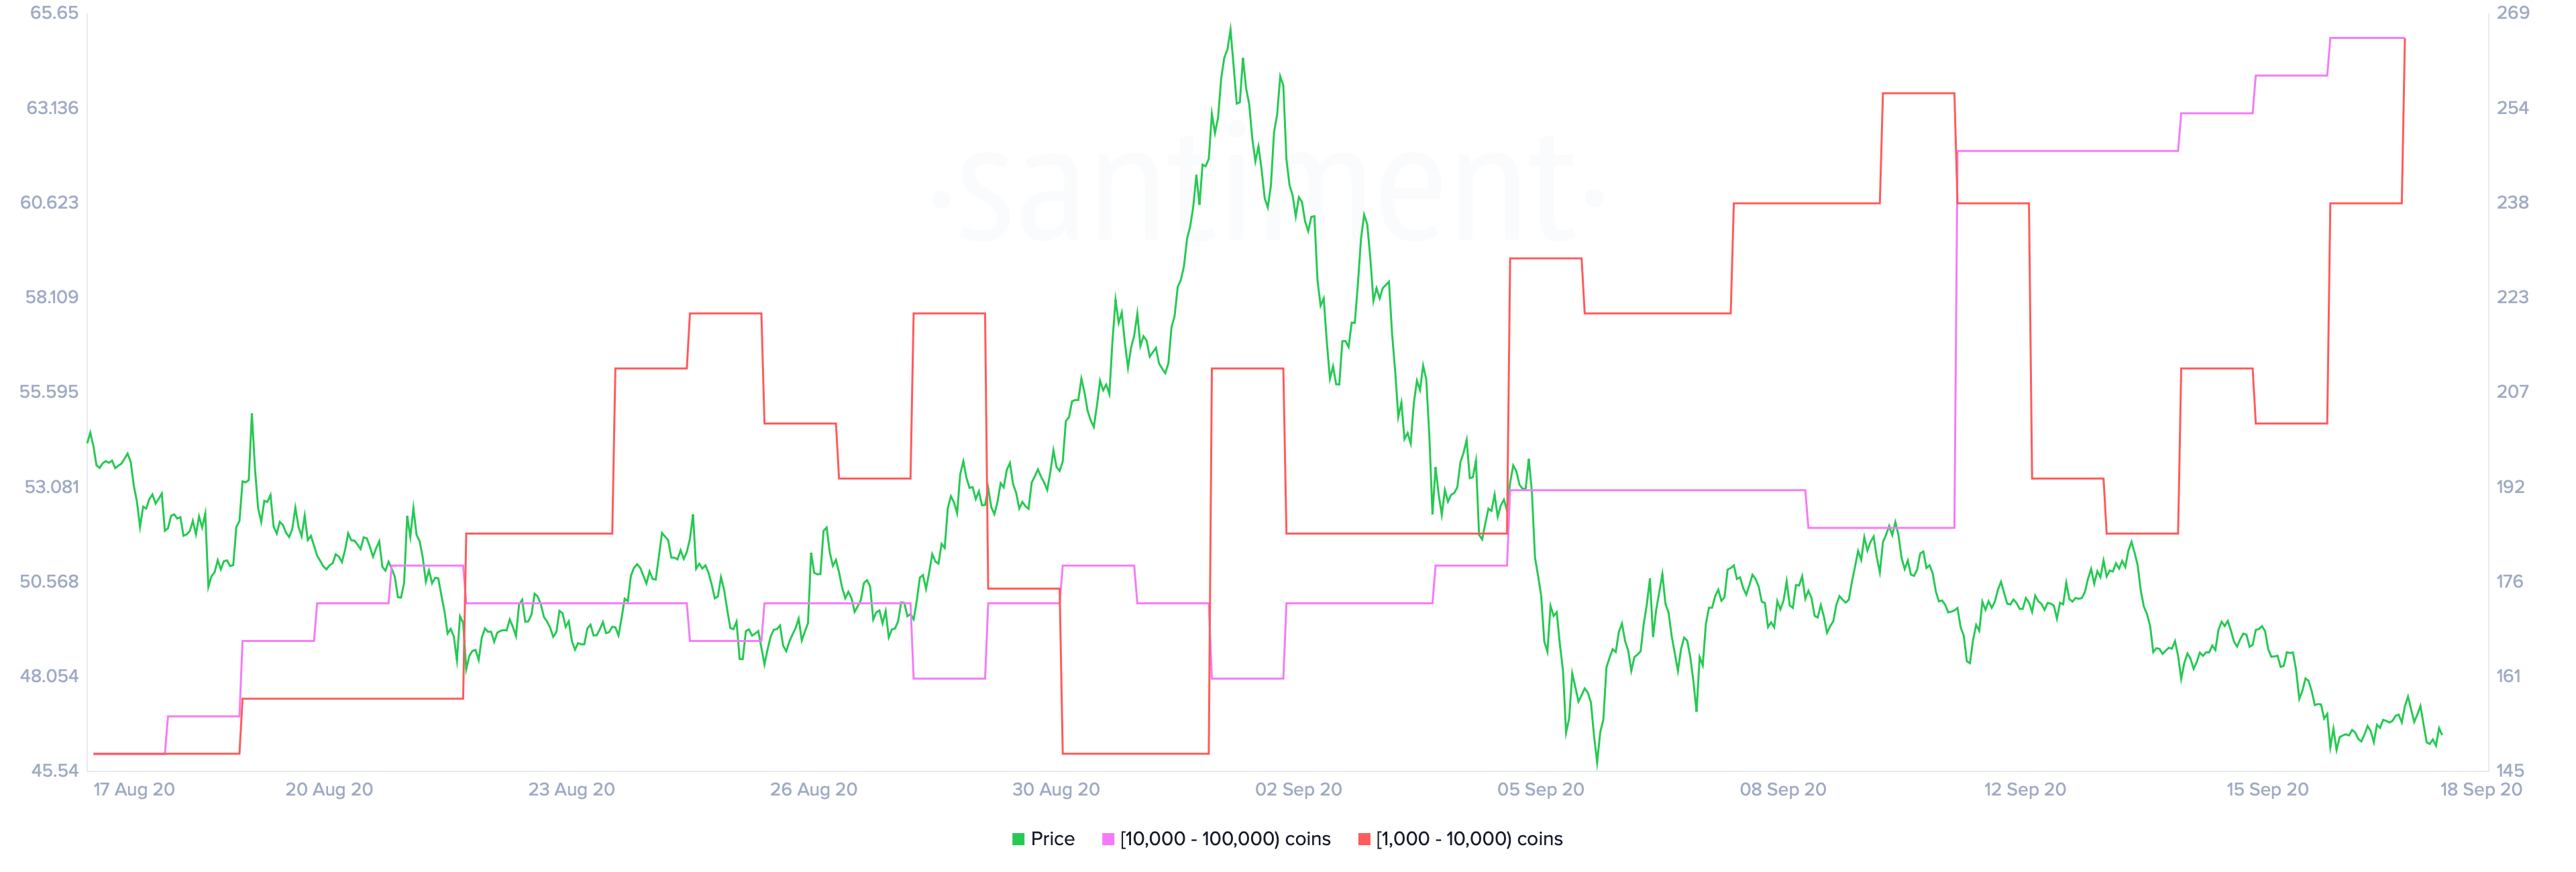
If the buy signal gets a continuation move, the next most significant resistance cluster is found at $168. It's worth noting that COMP whales have continued buying coins even though prices have been declining since the all-time high on September 1. This indicates long-term strength and huge interest in the digital asset.
COMP/USD 4-hour chart
-637359491314159085.png)
After holding another double bottom at $147, bulls are ready to bounce towards the next most crucial short-term resistance at $159.6. A clear breakout and close above this level should validate the buy signal on the 12-hour chart.
Author

Lorenzo Stroe
Independent Analyst
Lorenzo is an experienced Technical Analyst and Content Writer who has been working in the cryptocurrency industry since 2012. He also has a passion for trading.



