Chiliz uptrend under construction, but CHZ price waits for no one
- Chiliz price support is well-defined, creating a high probability trade opportunity.
- Monitor the 4-hour chart for the formation of a right shoulder to complete head-and-shoulders bottom.
- CHZ IOMAP data shows minor resistance until the $0.630-$0.647 range.

Chiliz price stabilized at the 100 twelve-hour simple moving average (SMA) during the recent sell-off offering market participants a precise level to trade against if the intra-day pattern unfolds as expected. The potential formation of a right shoulder will facilitate a timely entry point amidst the volatility.
Chiliz price resistance levels offer space to initiate new rally
Current Intotheblock In/Out of the Money Around Price data shows outstanding support at current levels down to the 50 twelve-hour SMA at $0.510, providing the support to frame a right shoulder and complete the head-and-shoulders bottom pattern.
Conversely, the IOMAP data doesn’t show any resistance until the $0.630-$0.647 range, creating the space for a breakout to develop upon pattern completion.
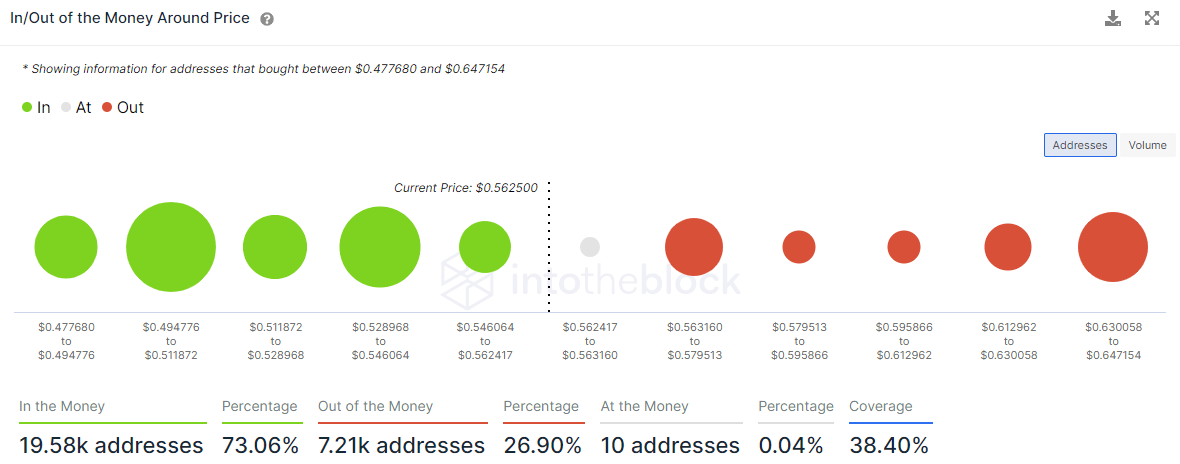
CHZ IOMAP data
The 12-hour chart shows muted selling over the last few bars as it discovered support at the 100 twelve-hour SMA, signifying that the selling pressure has largely been exhausted.
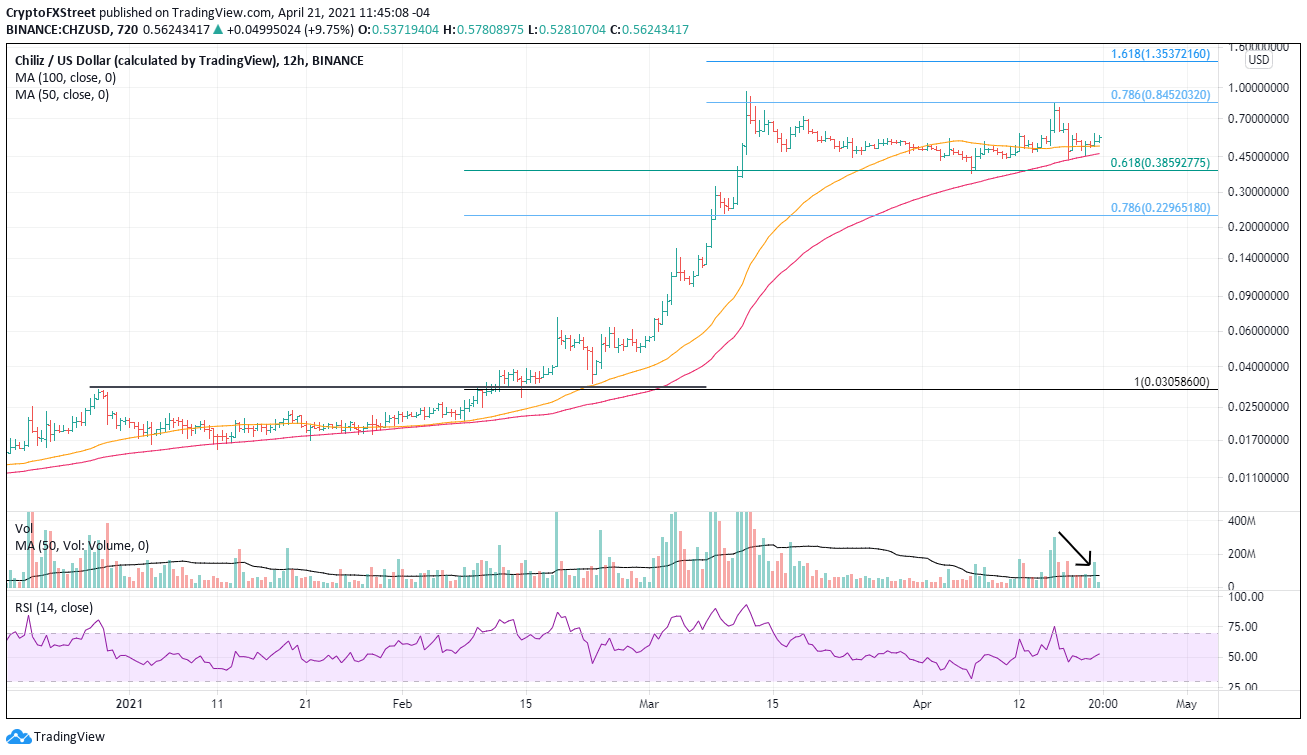
CHZ/USD 12-hour chart
It is valuable to examine lower timeframe intervals following sharp declines to identify emerging patterns that can facilitate earlier entry points, even if it is just a pilot position. In this case, an examination of the 4-hour chart shows a potential head-and-shoulders bottom forming. The pattern still needs to carve out the right shoulder, and it could take another 24 hours or six bars to complete. Speculators enter the trade above the neckline at $0.585.
Profit targets begin with the April 16 high at $0.869 and then the March high at $0.976. If $1 melts away, speculators can turn to the Fibonacci extensions of the March-April correction at $1.20 and $1.35 as the following range of resistance.
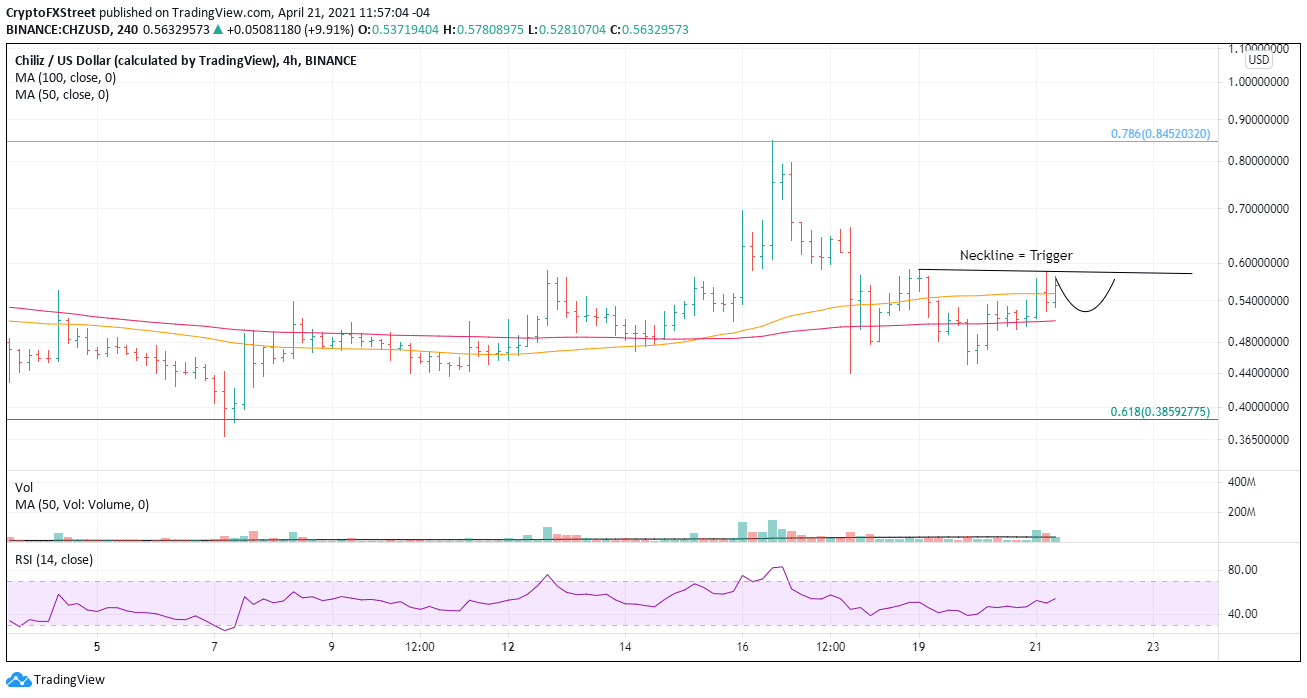
CHZ/USD 4-hour chart
Due to the reigning uncertainty in the cryptocurrency complex following the weekend’s crash, it is valuable for market participants to consider the alternative scenario. The first support following the 100 twelve-hour SMA is the 61.8% retracement of the rally from February to March at $0.385 and then the April low at $0.364.
Author

Sheldon McIntyre, CMT
Independent Analyst
Sheldon has 24 years of investment experience holding various positions in companies based in the United States and Chile. His core competencies include BRIC and G-10 equity markets, swing and position trading and technical analysis.


