Chiliz price handcuffed by strong resistance, projecting additional CHZ weakness
- Chiliz price overwhelms 200-day simple moving average (SMA) with a 25% plunge.
- CHZ rebound has been silenced by trend line resistance.
- In/Out of the Money Around Price metric reveals heavy resistance above the 200-day SMA.

Chiliz price spike due to the arrival of the European Cup and the Coinbase Pro listing was restrained by a congestion of resistance levels that promptly forced the sports token lower and below the 200-day SMA. Over the last two days, CHZ has tried to reclaim the strategically important moving average and May 23 trend line, but it has failed. As a result, not unlike other altcoins and despite the hype surrounding the huge soccer event, Chiliz price is locked in a struggle with no visible near-term support.
Chiliz price had the catalysts, but the cryptocurrency market overruled
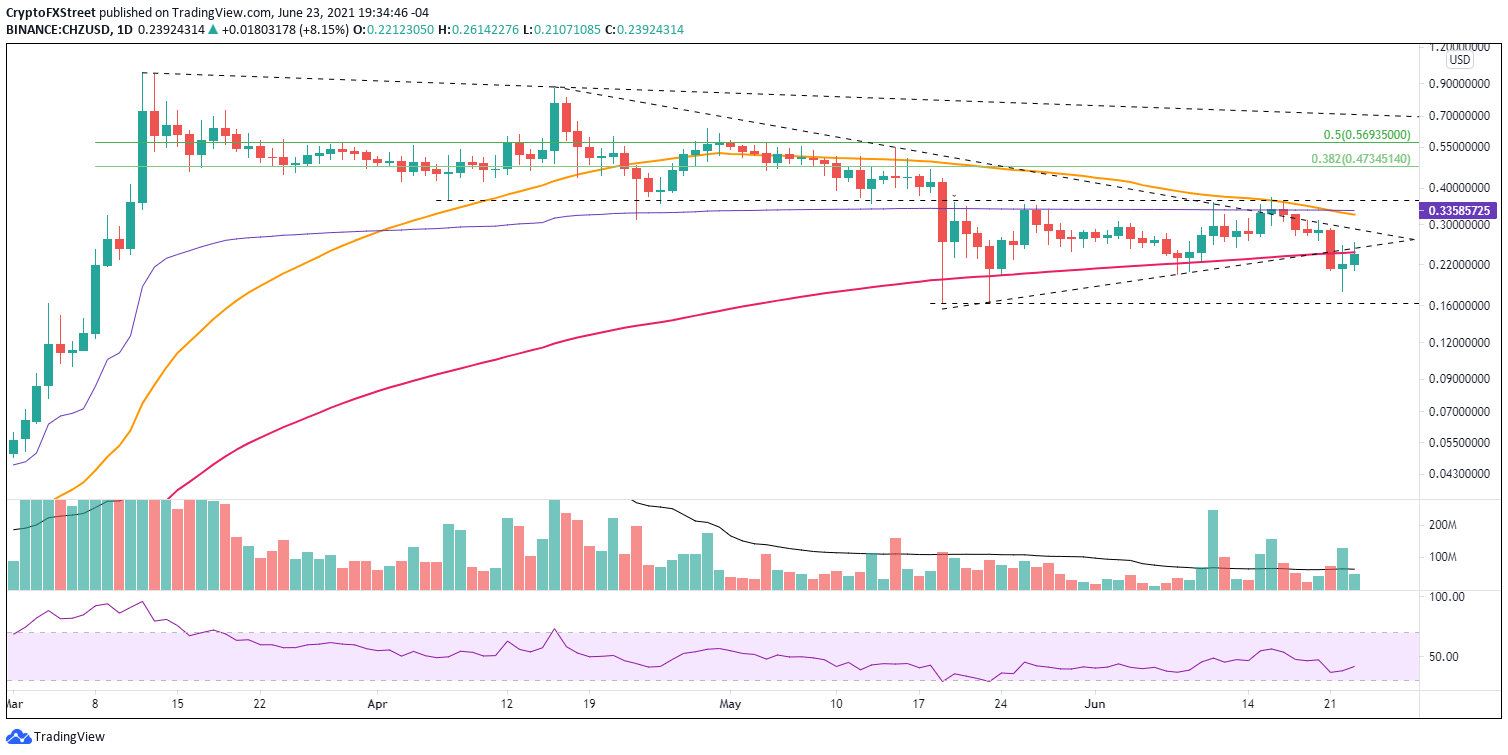
Chiliz price registered an 80% gain from the June 8 low to the June 16 high, taking advantage of the beginning of the European Cup and the surprise announcement that CHZ will be offered on the Coinbase Pro platform. However, the sharp rally was tamed by resistance determined by the intersection of the 50-day SMA, anchored VWAP and a resistance level originating on April 7.
The advantage of two important catalysts quickly faded, and Chiliz price plunged 50% over six days, highlighted by a 25% drop on June 21. The significant decline overwhelmed the 200-day SMA at $0.240 and the rising trend line from May 23.
Chiliz price has been unable to reclaim the two important levels the last two days, leaving sizeable wicks on the CHZ candlesticks, signifying a lack of commitment and residual selling pressure triggered by the resistance.
There is no evidence of credible support at this early point in the rebound that could sustain prices until the May 19 and 23 lows at $0.163 and $0.164, respectively. A decline to those levels would communicate a 30% decline from the current price and a total correction of over 80% from the March high.
The lack of an oversold reading on the daily Relative Strength Index (RSI) also points to more selling in the days ahead. A compelling Chiliz price low is best established off an oversold condition.
CHZ/USD daily chart
A daily close above the April declining trend line, currently at $0.289, could ignite a sustainable recovery. Still, CHZ investors need to be mindful of the declining 50-day SMA at $0.324 and the anchored VWAP from February 11 at $0.335. Both technical indicators were influential earlier this month.
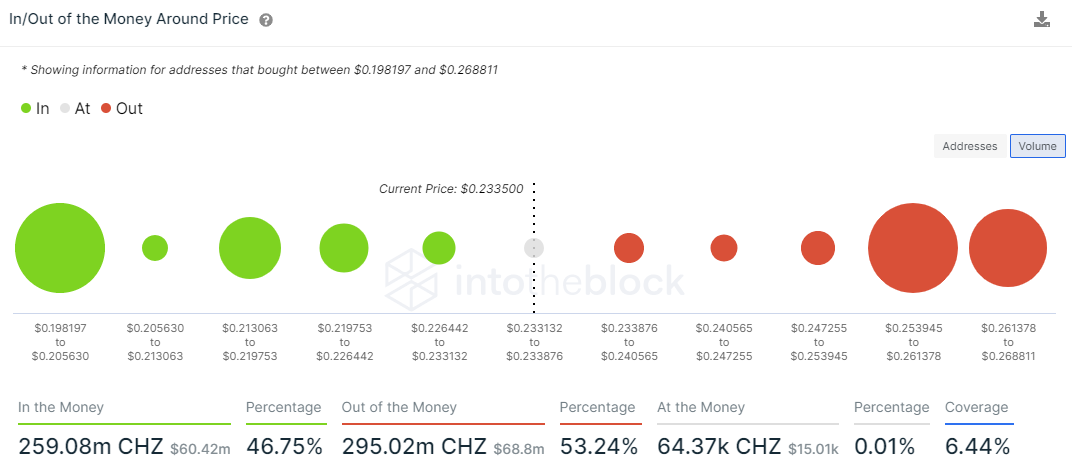
CHZ does not face any resistance based on the IntoTheBlock In/Out of the Money Around Price (IOMAP) metric at the current price. Instead, resistance (out of the money addresses) formulates at the $0.253-$0.261 range, where 1.15k addresses hold 169.7 million CHZ at an average price of $0.258. Thus, the price range correlates closely with yesterday’s high and today’s high, explaining the Chiliz price reversals.
The resistance does decrease slightly above $0.261, but there is still a cluster of 1.89k addresses owning 113.86 million CHZ at an average price of $0.265. Combined, they offer a formidable barrier against any aspirations to close Chiliz price well above the 200-day SMA.
CHZ IOMAP - IntoTheBlock
On the flip side, there is a large cluster of support (in the money addresses) between $0.198 and $0.205, suggesting a steady Chiliz price range for the near term.
The IOMAP data indicates a range-bound CHZ, and the technicals support a weaker Chiliz price with no outstanding support until the May 19 and 23 lows. With that said, investors should avoid taking on unnecessary risk until there is clarity in the price structure with precise points of entry and exit. It would be better to target other cryptocurrencies with clearer levels and timelier opportunities.
Author

Sheldon McIntyre, CMT
Independent Analyst
Sheldon has 24 years of investment experience holding various positions in companies based in the United States and Chile. His core competencies include BRIC and G-10 equity markets, swing and position trading and technical analysis.




