Chainlink Price Prediction: LINK hints at a sweep-the-lows event targeting $5.70
- Chainlink price has been producing higher lows since June.
- The Volume Profile Indicator shows bears have regained control of the higher time frames.
- Invalidation of the bearish thesis is a breach above $10, which could trigger an additional rally towards $12.
-637336005550289133.jpg)
Chainlink price has been finding support at higher levels since June. Still, the technicals show that the bears are still in control and will be aiming for liquidity levels below in the coming days.
Chainlink price could sweep the lows.
Chainlink price is showing mixed signals as the digital asset has been notoriously challenging to trade during September. The false breakouts and rejections near the $8 highs have been repetitive throughout the last few weeks. Nonetheless, the bulls have been stepping in at each low, highlighting an ascending trend line that has been established since June.
Chainlink price currently trades at $7.81. Upon the most recent rejection at $8.30 in September, an influx of volume poured into the market. On the 3-day chart, the volume completes a classic ramping pattern, suggesting the bears are in full control.
Additionally, the bulls have not produced equal or more volume during the current retaliation. The lack of bullish involvement on the Volume Profile justifies the idea that a sweep-the-lows event is due for the LINK price. The $5.70 level is a probable target as multiple unfinished auctions lie in the vicinity.
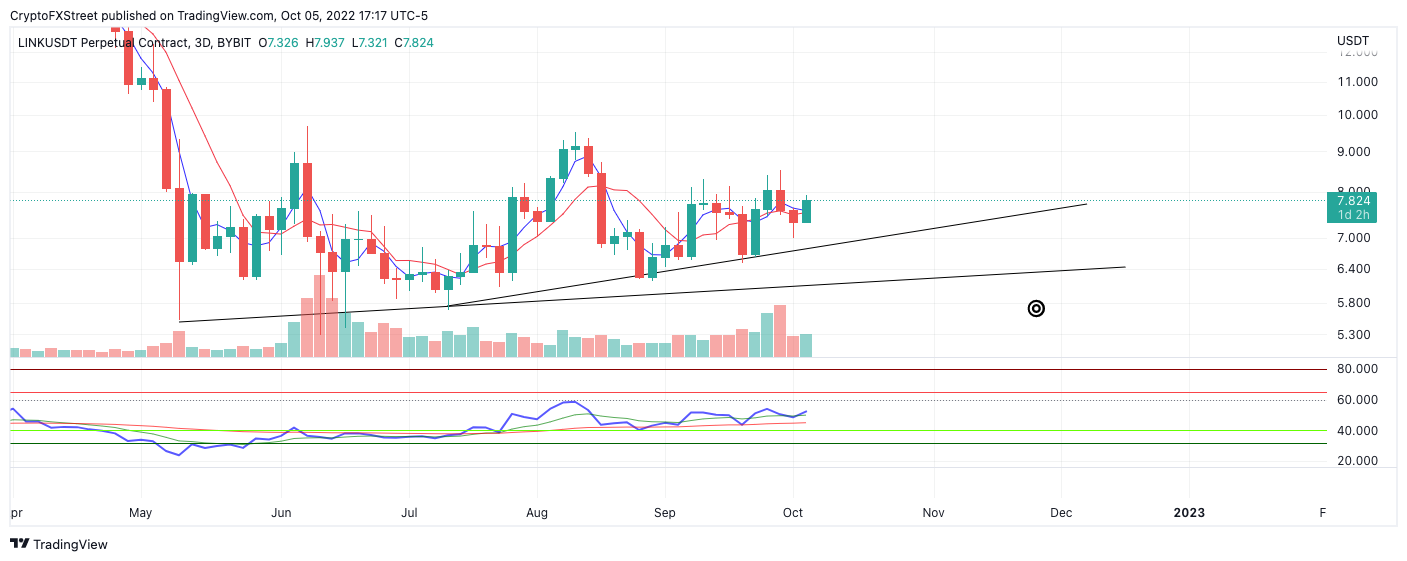
LINK/USDT 3-Day Chart
The bulls could still produce another high, so traders must be aware of the opposite scenario. The fourth retest of the ascending trend line will likely catalyze the next volatile movement. The bearish thesis will be void if the bulls can produce a breach of the thrust candle at $10. The candle was the catalyst that brought the Chainlink price into the current range. A 60% rally could occur towards previously broken support at $15 if the LINK price invalidates the bearish thesis.
In the following video, our analysts deep dive into the price action of Bitcoin, analyzing key levels of interest in the market. -FXStreet Team
Author

Tony M.
FXStreet Contributor
Tony Montpeirous began investing in cryptocurrencies in 2017. His trading style incorporates Elliot Wave, Auction Market Theory, Fibonacci and price action as the cornerstone of his technical analysis.


