Chainlink Price Forecast: LINK prepares for a massive 33% breakout to $18
- The IOMAP model reveals that LINK has a relatively smooth path to $15.
- Chainlink is building upon the ascending parallel channel’s lower boundary support for gains targeting $18.
-637336005550289133.jpg)
Chainlink has sustained an impressive uptrend from September lows around $7.2. The decentralized oracle price feed token recently hit a snag at $16 and retreated considerably to the support slightly above $11. Meanwhile, technicals seem to have started improving, hence the potential breakout to $18.
Chainlink to remains stable ahead of the liftoff
At the time of writing, LINK is trading at $13.5. Slightly below the price is the ascending parallel channel’s lower boundary support. A gradually building bullish momentum is likely to pull LINK above the next short-term hurdle at $14.
A break above the channel’s middle boundary would cement the bulls’ position in the market. Additionally, if demand increases for Chainlink, a breakout above the ascending parallel channel might elevate the price towards the ultimate goal of $18.
The bullish momentum has been validated by a recent golden cross formed by the 50-day Simple Moving Average crossing above the 100-day SMA. Besides, LINK/USD is generally in the bulls’ hands based on the gap created by the 50 SMA above the 200 SMA.
-637424930765935533.png)
LINK/USD daily chart
IntoTheBlock’s IOMAP model reveals the lack of formidable resistance areas towards $15. In other words, Chainlink could quickly extend the bullish leg upwards, hence validating the technical optimism. However, some delay may be faced between $13.5 and $13.9. Here, roughly 3,400 addresses had previously purchased nearly 7.9 million LINK.
-637424933694910889.png)
Chainlink IOMAP chart
On the downside, LINK is holding above areas of immense support, as shown by the model. The most robust support lies between $11.5 and $11.9. Here, approximately 8,700 addresses had previously bought nearly 39.5 million LINK. Above this zone, other support levels could absorb some of the selling pressure in case of a significant correction.
It is worth mentioning that Chainlink will invalidate the bullish outlook if the price lost the position within the ascending parallel channel. Besides, if losses stretched past the 50-day SMA and 100-day SMA, LINK might be forced to revisit last week’s support above $11 or the 200-day anchor, highlighted under $10.
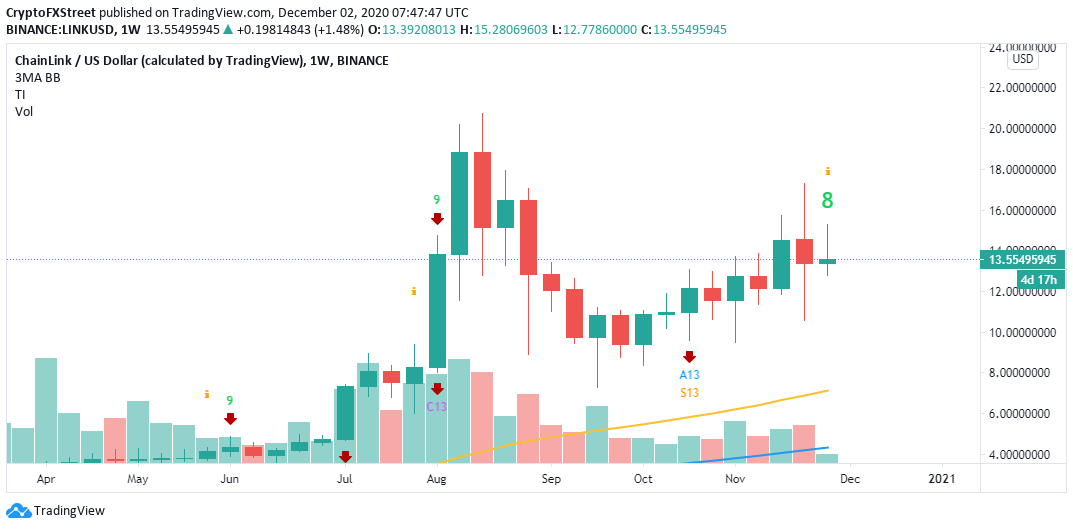
LINK/USD weekly chart
The TD Sequential indicator will likely present a sell signal on the weekly chart in the coming sessions. The call to sell will manifest in a green nine candlestick. If validated, LINK would spiral massively, perhaps even refresh lows under $10. Note that the last time the signal formed on the weekly chart, Chainlink dumped at least 57%.
Author

John Isige
FXStreet
John Isige is a seasoned cryptocurrency journalist and markets analyst committed to delivering high-quality, actionable insights tailored to traders, investors, and crypto enthusiasts. He enjoys deep dives into emerging Web3 tren


