Chainlink Price Forecast: LINK hovers around $23 as AUM hits $137 million
- Chainlink holds above $23.00, backed by steady institutional demand and a strong technical structure.
- LINK saw $3.6 million in capital inflows last week, bringing the total AUM to $137 million.
- Chainlink is positioned above key moving averages with the SuperTrend indicator’s buy signal backing bullish sentiment.

Chainlink (LINK) extends its consolidation above its short-term support level at $23.00 as the broader cryptocurrency market remains in a risk-off sentiment. The oracle token exchanges hands 16% below the August peak of $27.85, reflecting the impact of macroeconomic uncertainty.
According to the CME Fedwatch tool, there is an 87.6% chance that the Federal Reserve (US) will cut interest rates by 25 basis points (bps) to a range of 4% to 4.25% – a potential lifeline for risk asset classes, such as crypto and Equities.
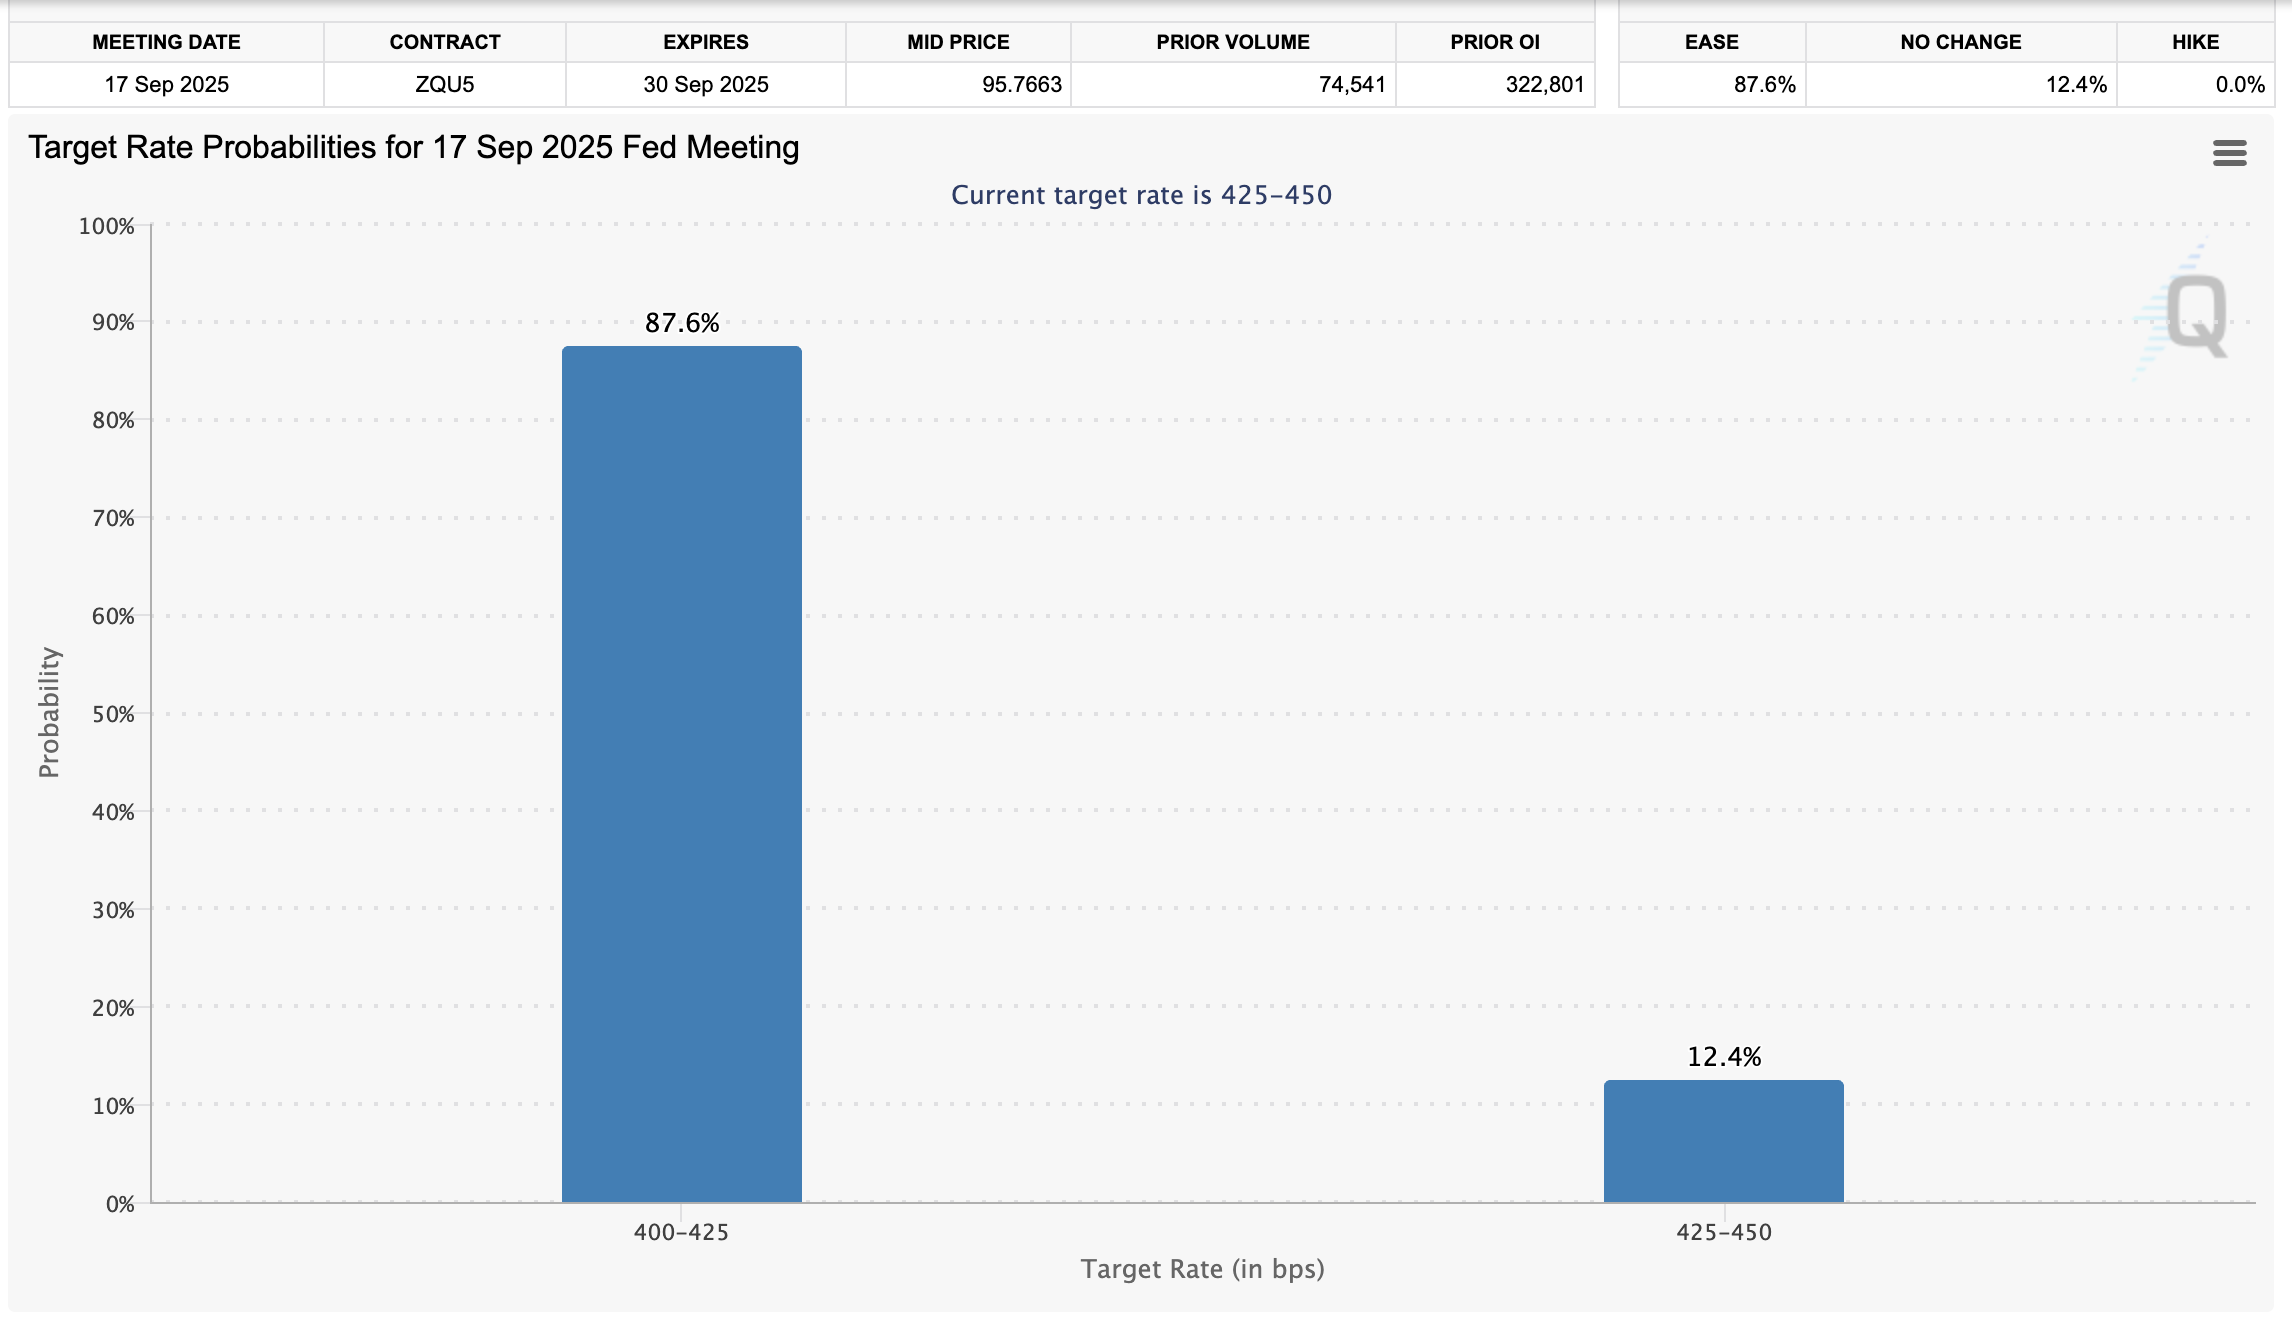
FedWatch Tool | Source: CME Group
Chainlink captures institutional interest
Digital investment products gained momentum last week despite the widespread price fluctuations. According to CoinShares, cumulatively, digital assets saw capital inflows of $2.48 billion last week. Inflows into LINK-related financial products increased $3.6 million from $2.1 million as recorded in the previous week.
Chainlink’s month-to-date (MTD) inflows currently average at $7.7 million, bringing the year-to-date (YTD) inflows to $33 million and the total assets under management (AUM) to $137 million.
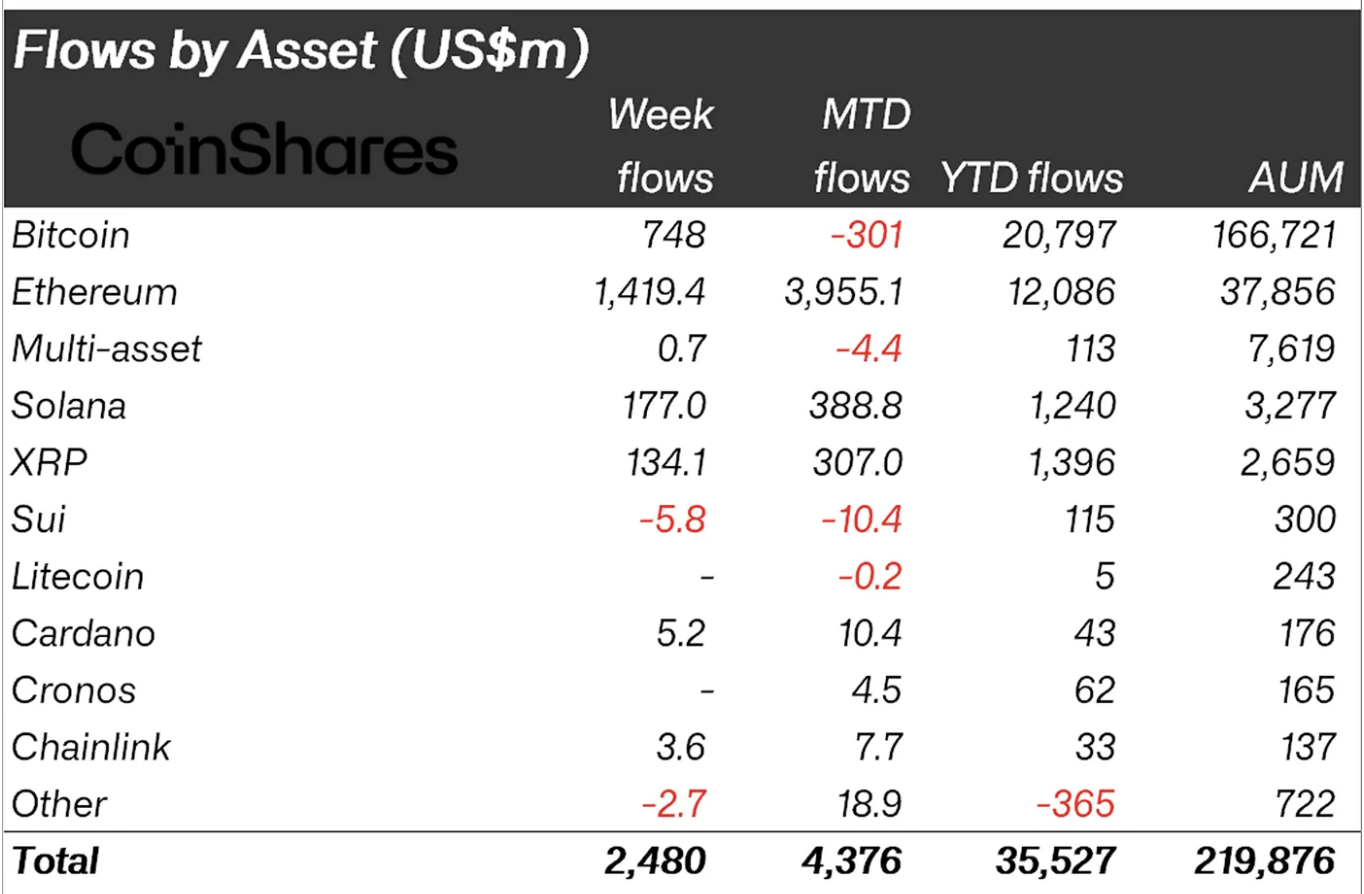
Digital assets inflows | Source: CoinShares
Still, retail interest shows signs of weakening based on the LINK futures Open Interest (OI), which has declined to $1.53 billion after peaking at $1.91 billion on August 24.
If OI, which represents the notional value of outstanding futures contracts, sustains the correction, falling demand for Chainlink could leave the token susceptible to losses in upcoming sessions.
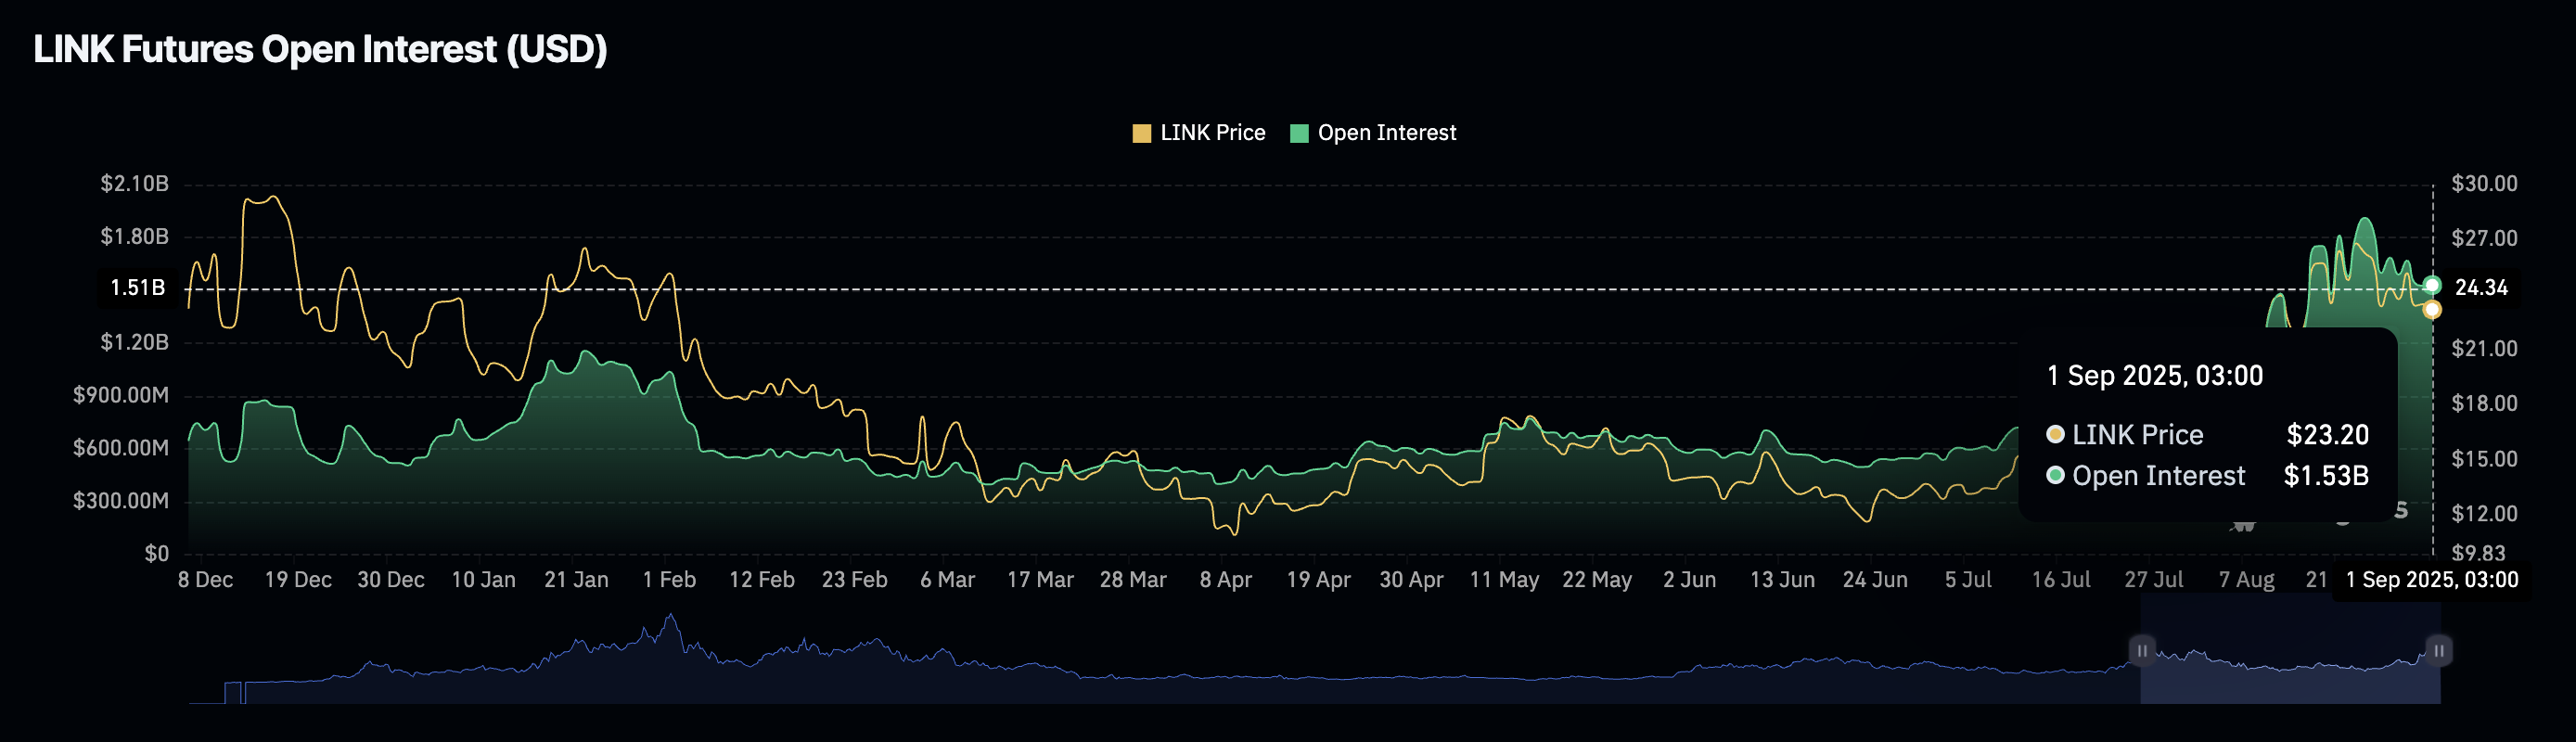
Chainlink Futures Open Interest | Source: CoinGlass
Technical outlook: Chainlink consolidates ahead of breakout
Chainlink consolidates above its short-term support at $23.00 at the time of writing. Bulls are ready to defend this level, subsequently preventing further decline to the round-figure support at $20.00.
LINK’s bullish outlook has the backing of a buy signal from the SuperTrend indicator, which was triggered on August 8. This trend-following tool serves as dynamic support when trailing the Chainlink price.
The 50-day Exponential Moving Average (EMA) at $21.13, the 100-day EMA at $18.91 and the 200-day EMA at $17.49 reinforce the bullish sentiment likely to uphold investor interest in the token ahead of the next breakout toward resistance at $27.86, which was tested on August 22, and the supply at $30.93, tested in mid-December.
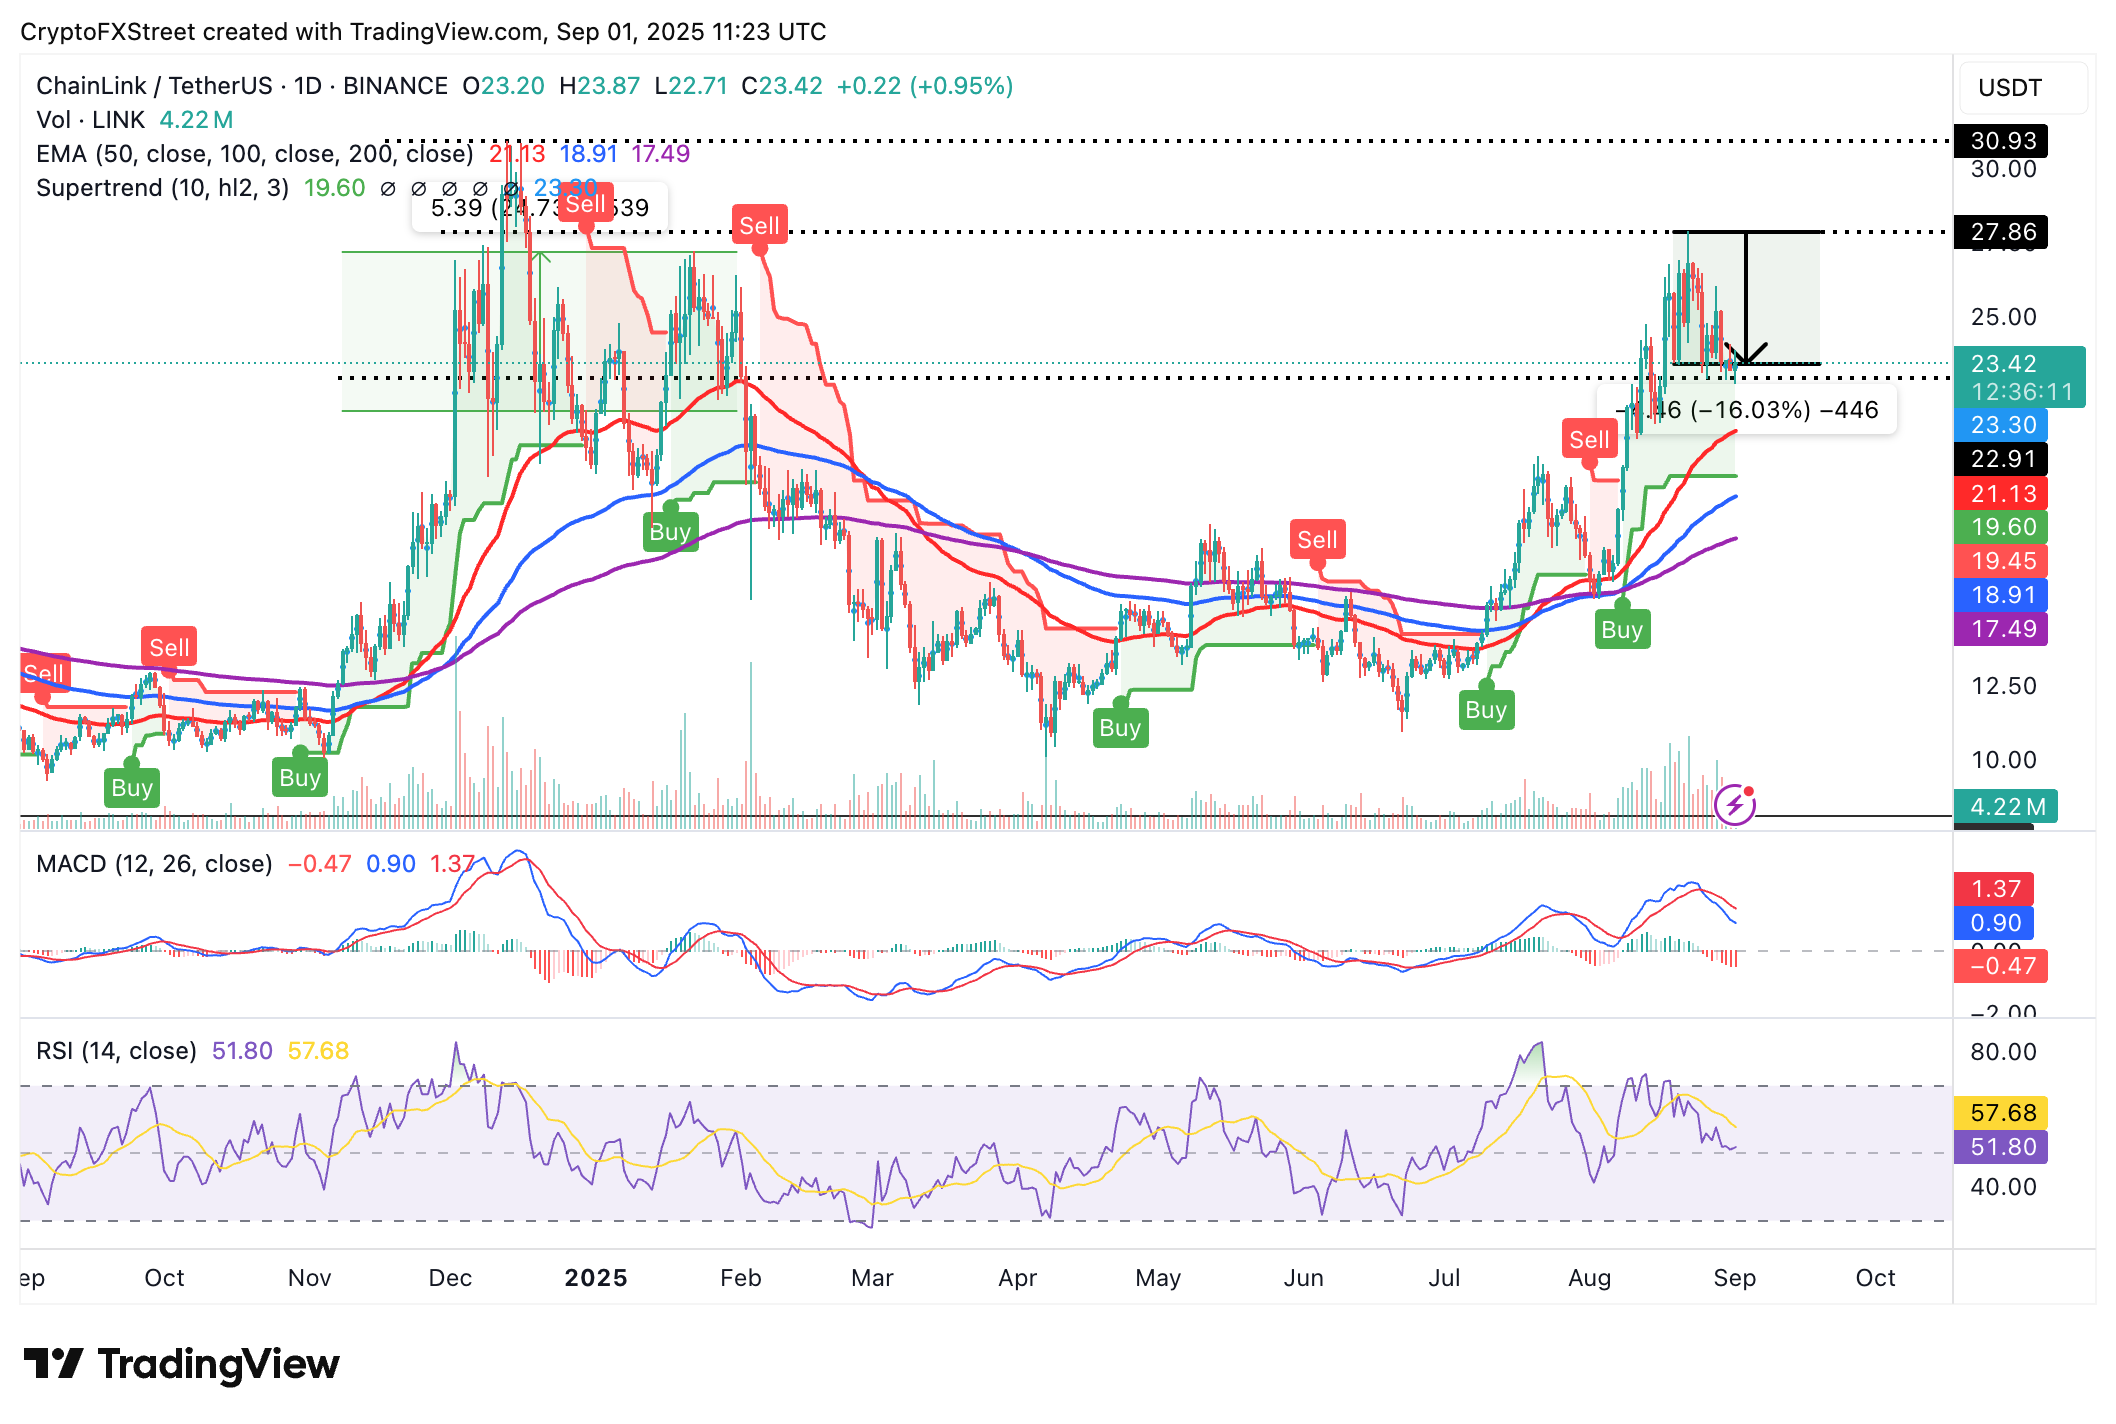
LINK/USD daily chart
Still, the Moving Average Convergence Divergence (MACD) indicator suggests that investors cannot dismiss bearish sentiment, particularly with a sell signal maintained since August 24.
The Relative Strength Index (RSI) remains stable above the midline, supporting the current sideways price action and affirming the bullish grip if it rebounds toward overbought territory.
Open Interest, funding rate FAQs
Higher Open Interest is associated with higher liquidity and new capital inflow to the market. This is considered the equivalent of increase in efficiency and the ongoing trend continues. When Open Interest decreases, it is considered a sign of liquidation in the market, investors are leaving and the overall demand for an asset is on a decline, fueling a bearish sentiment among investors.
Funding fees bridge the difference between spot prices and prices of futures contracts of an asset by increasing liquidation risks faced by traders. A consistently high and positive funding rate implies there is a bullish sentiment among market participants and there is an expectation of a price hike. A consistently negative funding rate for an asset implies a bearish sentiment, indicating that traders expect the cryptocurrency’s price to fall and a bearish trend reversal is likely to occur.
Author

John Isige
FXStreet
John Isige is a seasoned cryptocurrency journalist and markets analyst committed to delivering high-quality, actionable insights tailored to traders, investors, and crypto enthusiasts. He enjoys deep dives into emerging Web3 tren


