|

Chainlink Price Forecast: LINK breaks below ascending triangle

  • Chainlink fell after encountering heavy resistance.
  • The bears aim to take LINK down to $11.

Chainlink rose from $10.25 on November 5 to $13.45 on November 6 before dropping back to $11.75 the next day. As of writing, LINK is in a pretty precarious position that could define its price action in the days to come.

Chainlink breaks below ascending triangle

Chainlink has been trending in the 4-hour chart since November 7. LINK has been on an upswing, with the buyers aiming for the $13.45 resistance level. However, the bears managed to take control and dip the price below the triangle formation. As per technical analysis, the price target for the sellers is around $11.

LINK/USD daily chart

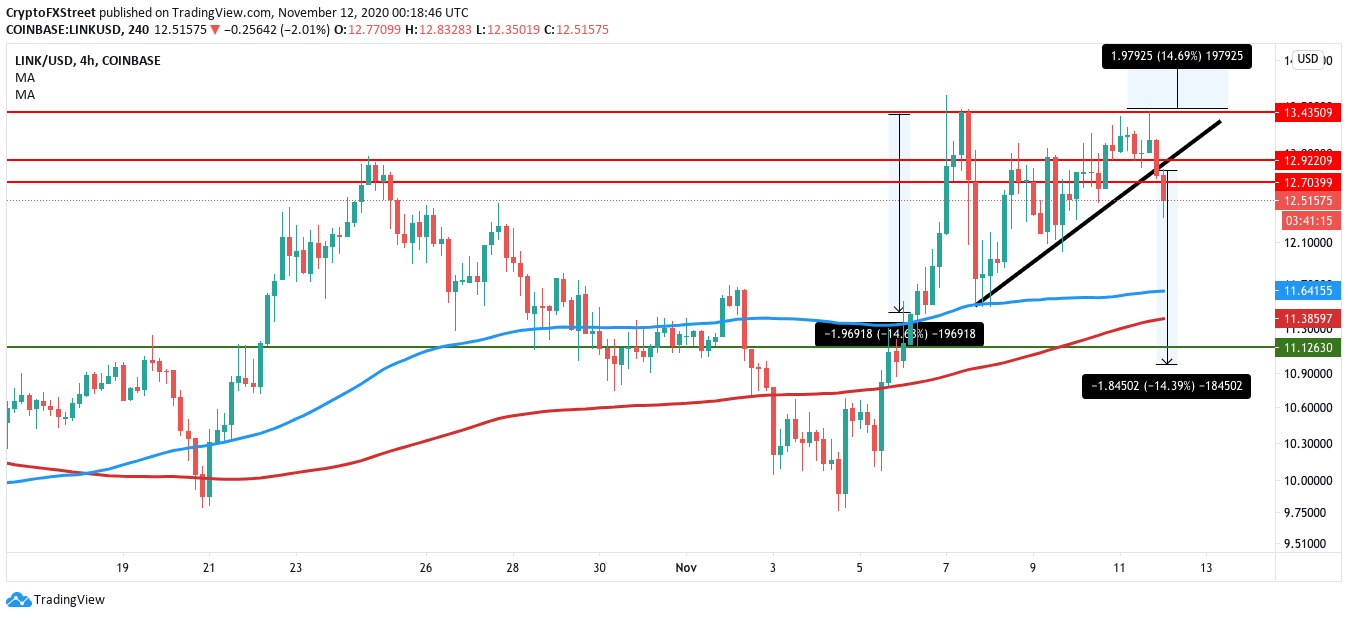
LINK/USD 4-hour chart

IntoTheBlock’s In/Out of the Money Around Price (IOMAP) helps us visualize strong support and resistance levels. The IOMAP shows us a strong resistance barrier between $12.50 to $13.25. On the downside, the decentralized oracle network has a healthy support wall at $11.25. A break below that takes LINK to $10.85. This validates our predetermined price target of $11.
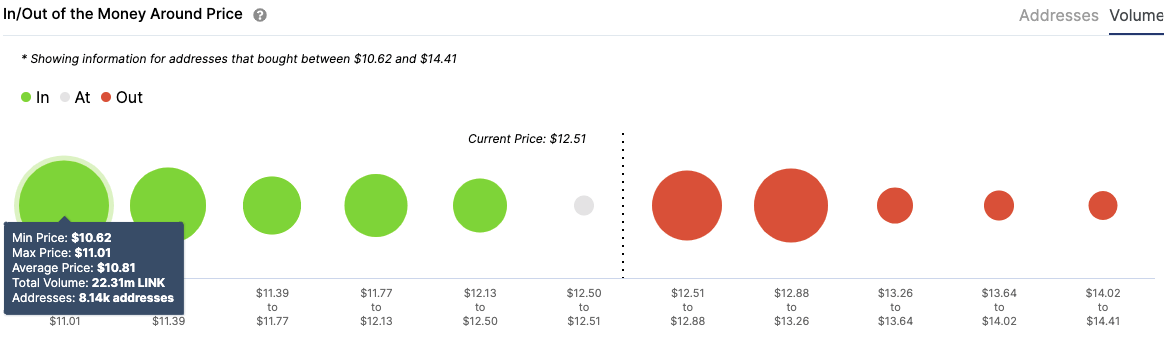
fxsoriginal

LINK IOMAP

The number of addresses entering the network over the last month reached a high of 3,080 on November 7. Since then, this number dipped to 2,210, before rising to 2,440. This is a positive sign as it shows that the network is growing.
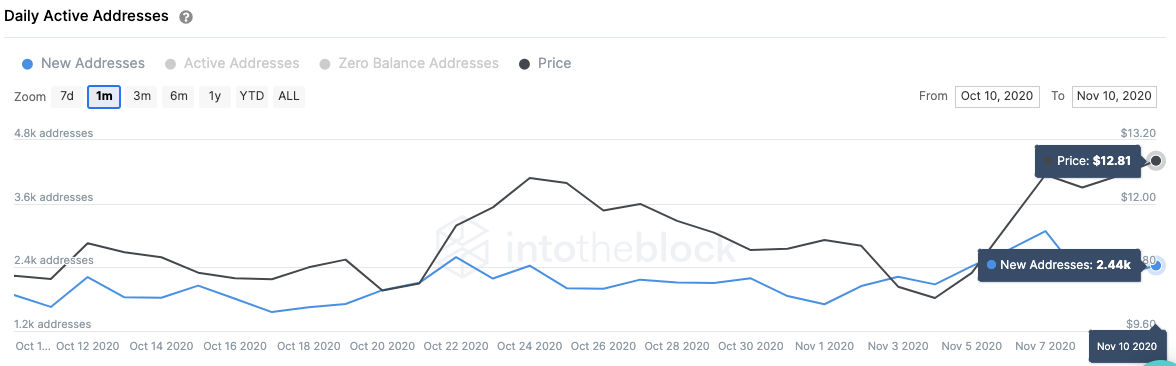
fxsoriginal

LINK addresses

If the buyers take back control, they will take the price up to $12.50 before encountering strong resistance. If the bears remain in control, then one can LINK to drop till the $11-mark.
 

Author

Rajarshi Mitra

Rajarshi Mitra

Independent Analyst

Rajarshi entered the blockchain space in 2016. He is a blockchain researcher who has worked for Blockgeeks and has done research work for several ICOs. He gets regularly invited to give talks on the blockchain technology and cryptocurrencies.

More from Rajarshi Mitra
Share:

Editor's Picks

Ripple exposed to volatility amid low retail interest, modest fund inflows

Ripple (XRP) is extending its intraday decline to around $1.40 at the time of writing on Monday amid growing pressure from the retail market and risk-off sentiment that continues to keep investors on the sidelines.

Crypto Today: Bitcoin steadies around $70,000, Ethereum and XRP remain under pressure 

Bitcoin hovers around $70,000, up near 15% from last week's low of $60,000 despite low retail demand. Ethereum delicately holds $2,000 support as weak technicals weigh amid declining futures Open Interest.

Pi Network extends decline as steady mainnet migration adds pressure

PI edges lower by over 3% at press time on Monday, marking a third consecutive day of losses. The declining trend in PI aligns with the steady mainnet migration of PI tokens, which may fuel selling pressure. The technical outlook for PI remains bearish, with bearish momentum persisting. 

Bitcoin slips below $70,000 as ETF outflows, realized losses fuel bearish outlook

Bitcoin price trades in red below $70,000 on Monday after correcting nearly 9% in the previous week. US-listed spot ETFs recorded a $318 million weekly outflow, marking the third consecutive week of withdrawals.

Bitcoin Price Annual Forecast: BTC holds long-term bullish structure heading into 2026

Bitcoin (BTC) is wrapping up 2025 as one of its most eventful years, defined by unprecedented institutional participation, major regulatory developments, and extreme price volatility.

Bitcoin: The worst may be behind us

Bitcoin (BTC) price recovers slightly, trading at $65,000 at the time of writing on Friday, after reaching a low of $60,000 during the early Asian trading session. The Crypto King remained under pressure so far this week, posting three consecutive weeks of losses exceeding 30%.