Chainlink price aims for $18 after a strong rebound from a critical support level
- Chainlink price is bounded inside a long-term ascending parallel channel on the 12-hour chart.
- Bulls have defended a significant support level and aim to push LINK towards the top of the pattern.
-637336005550289133.jpg)
After a significant blow on August 16 from its all-time high at $20.11, Chainlink has tried to bounce back up since September 23. The digital asset continues trading inside an ascending parallel channel on the 12-hour chart.
Chainlink price could be aiming for the top again
On December 11, Chainlink price touched the lower trendline of the ascending parallel channel, around 11.50, but bulls defended it with significant continuation moves on December 12, with LINK jumping 14% within the next 48 hours.
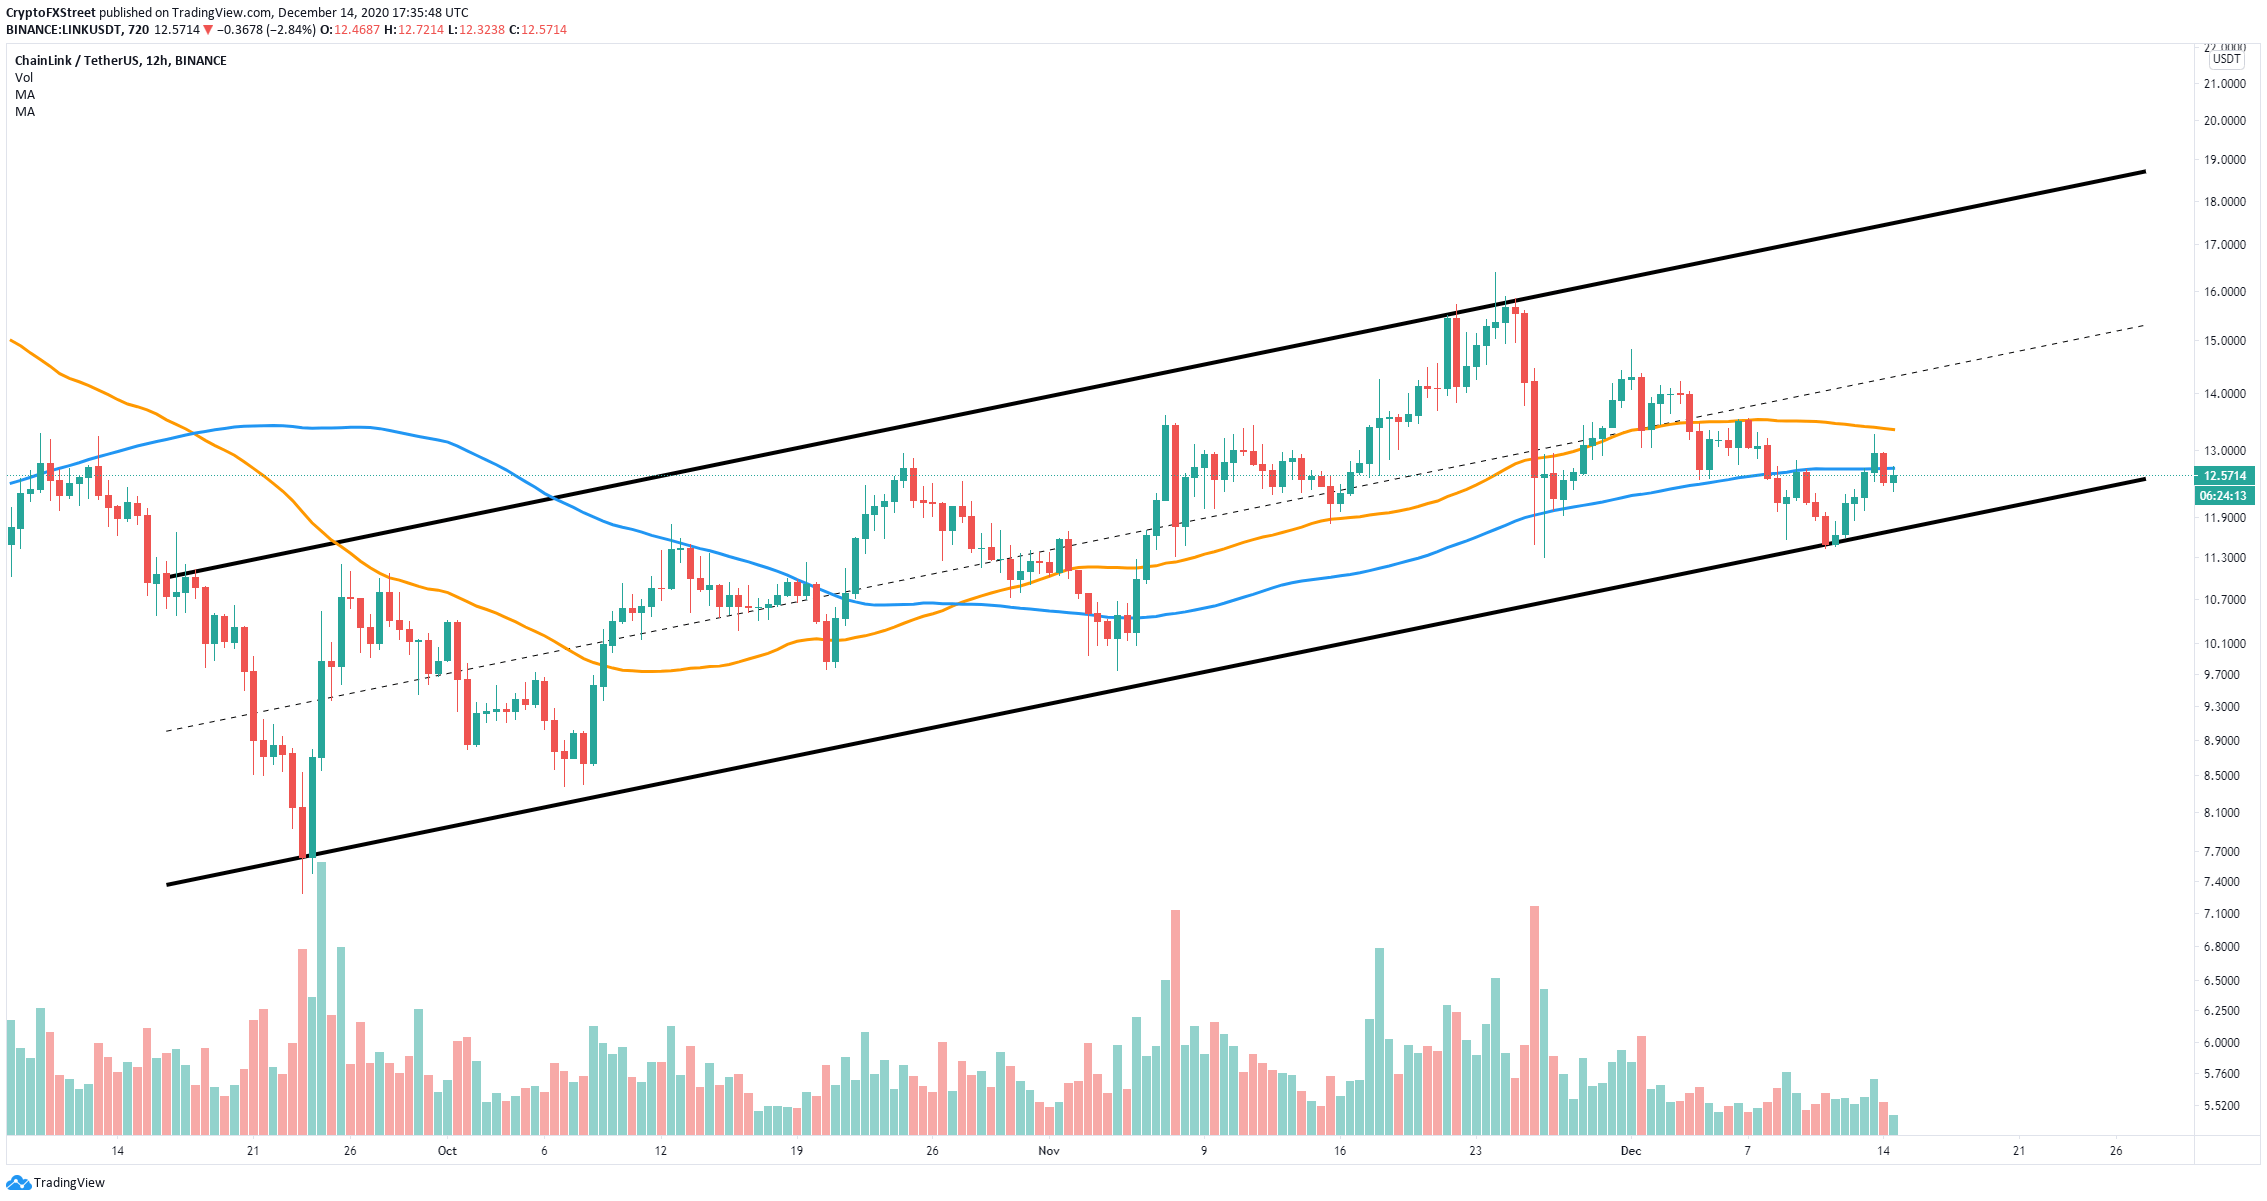
LINK/USD 12-hour chart
The next hurdle for the bulls is the 100-SMA resistance level at $12.7. Climbing above this point would quickly push Chainlink price towards the 50-SMA at $13.3. Besides that, the next potential price target would be the top of the pattern at $18 in the long-term.
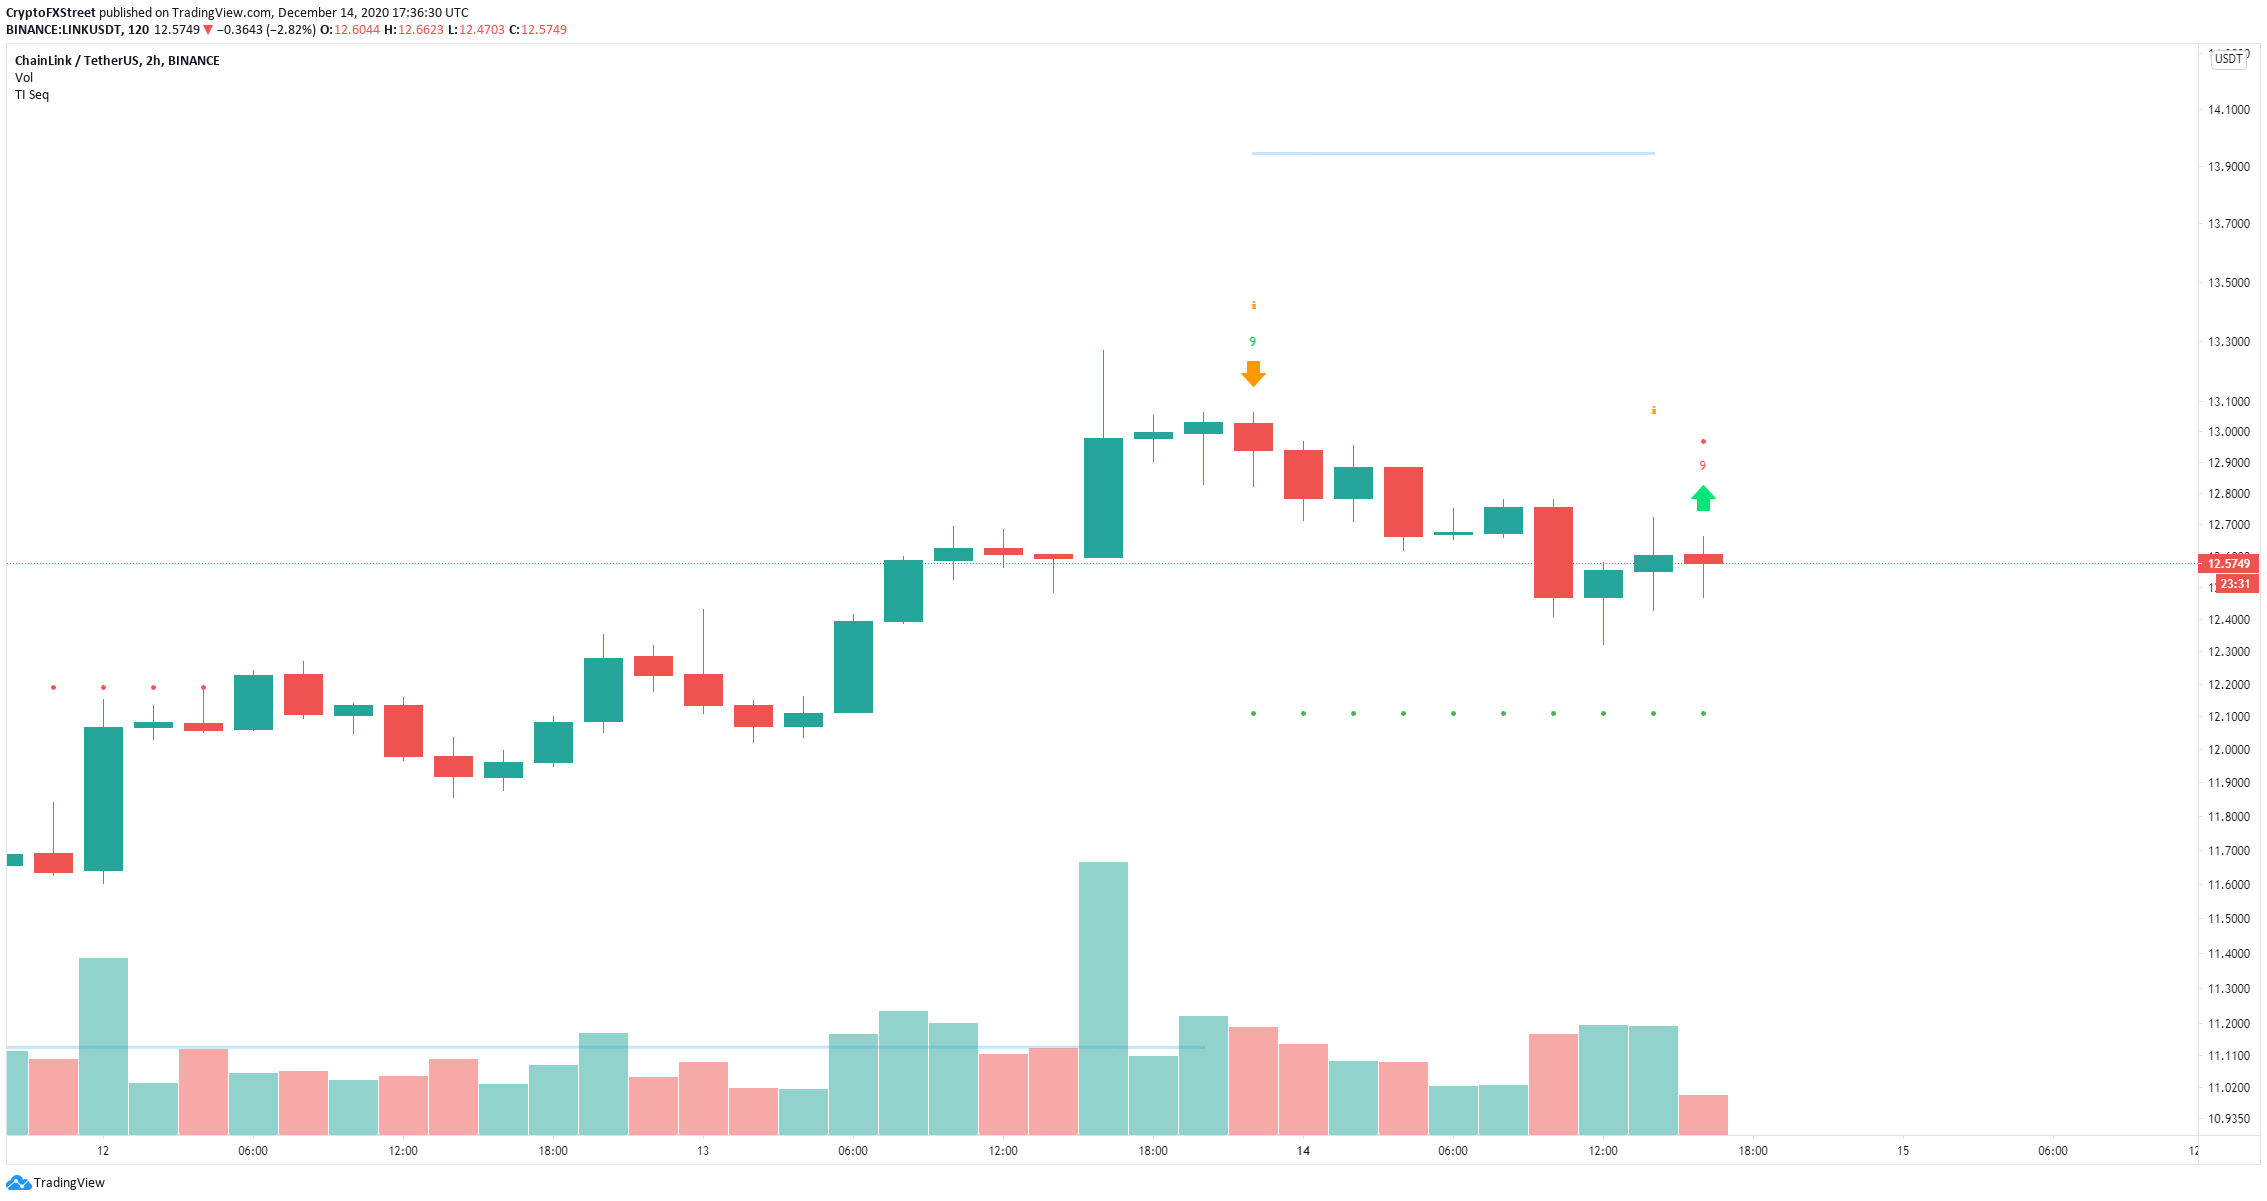
LINK/USD 2-hour chart
Additionally, the TD Sequential indicator has just presented a buy signal on the 2-hour chart, which adds credence to the bullish outlook in the short-term. Furthermore, the In/Out of the Money Around Price (IOMAP) chart shows very little opposition on the way up.
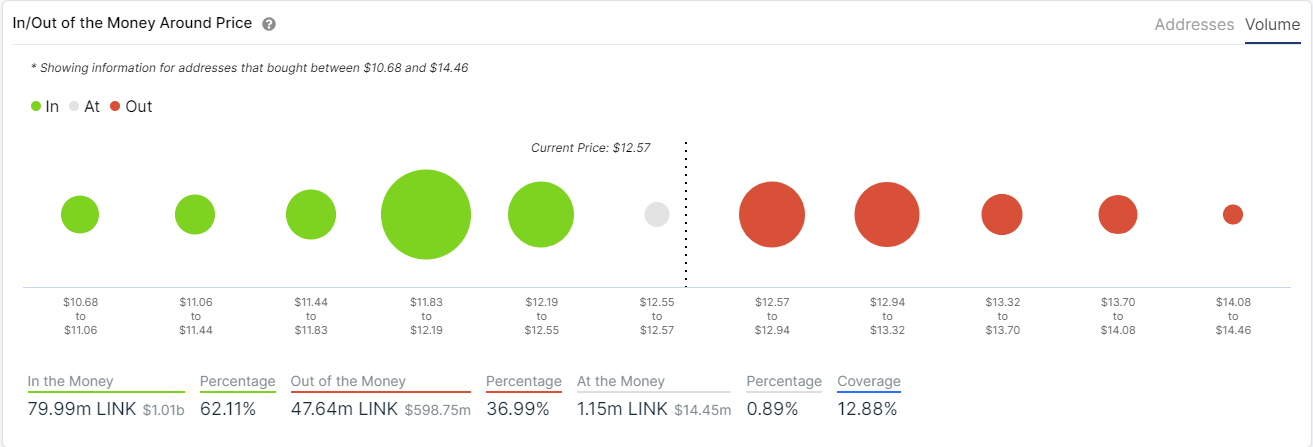
LINK IOMAP chart
The most significant resistance area is located between $12.94 and $13.32, which coincides with the 50-SMA resistance level on the 12-hour chart. A breakout above this point would suggest LINK is ready for a test of $18.
However, a rejection from the 100-SMA on the 12-hour chart can quickly drive Chainlink price towards the lower trendline support of the pattern again. A breakdown below this point would have a devastating effect over LINK, potentially pushing it to $8.
Author

Lorenzo Stroe
Independent Analyst
Lorenzo is an experienced Technical Analyst and Content Writer who has been working in the cryptocurrency industry since 2012. He also has a passion for trading.


