Cardano price undecided on setting local bottom, ADA hesitant on trend reversal
- Cardano price has approached a potential turning point following a month of underperformance.
- ADA recorded a monthly low, and a technical indicator is signaling a local bottom.
- However, indecision continues to mount for Cardano for the time being.

Cardano price appears to be forming a local bottom, although indecision continues to consuming ADA. The public blockchain crypto is struggling to hold onto critical support, although a technical indicator suggests a trend reversal may be in store.
Cardano price flooded with indecision
Cardano price has recorded its monthly low at $1.15, failing to galvanize investors’ enthusiasm. ADA has broken below a rising wedge pattern on the daily chart, which resulted in nearly a steep decline.
The rising wedge pattern projected a 14% drop for Cardano price. Since ADA bears have been taking control, the asset fell further by a total of 17% to $1.15.
Cardano price appears to be searching for a bottom, supported by the diagonal declining trend line that emerged on June 5. ADA seems to be aiming for a trend reversal, as the Momentum Reversal Indicator (MRI) flashed two consecutive buy signals.
To reverse the period of underperformance, Cardano price must close above the aforementioned support trend line for a bullish forecast to emerge. Should ADA witness accelerated interest, it could realize an 11% gain, reaching the 61.8% Fibonacci extension level at $1.30.
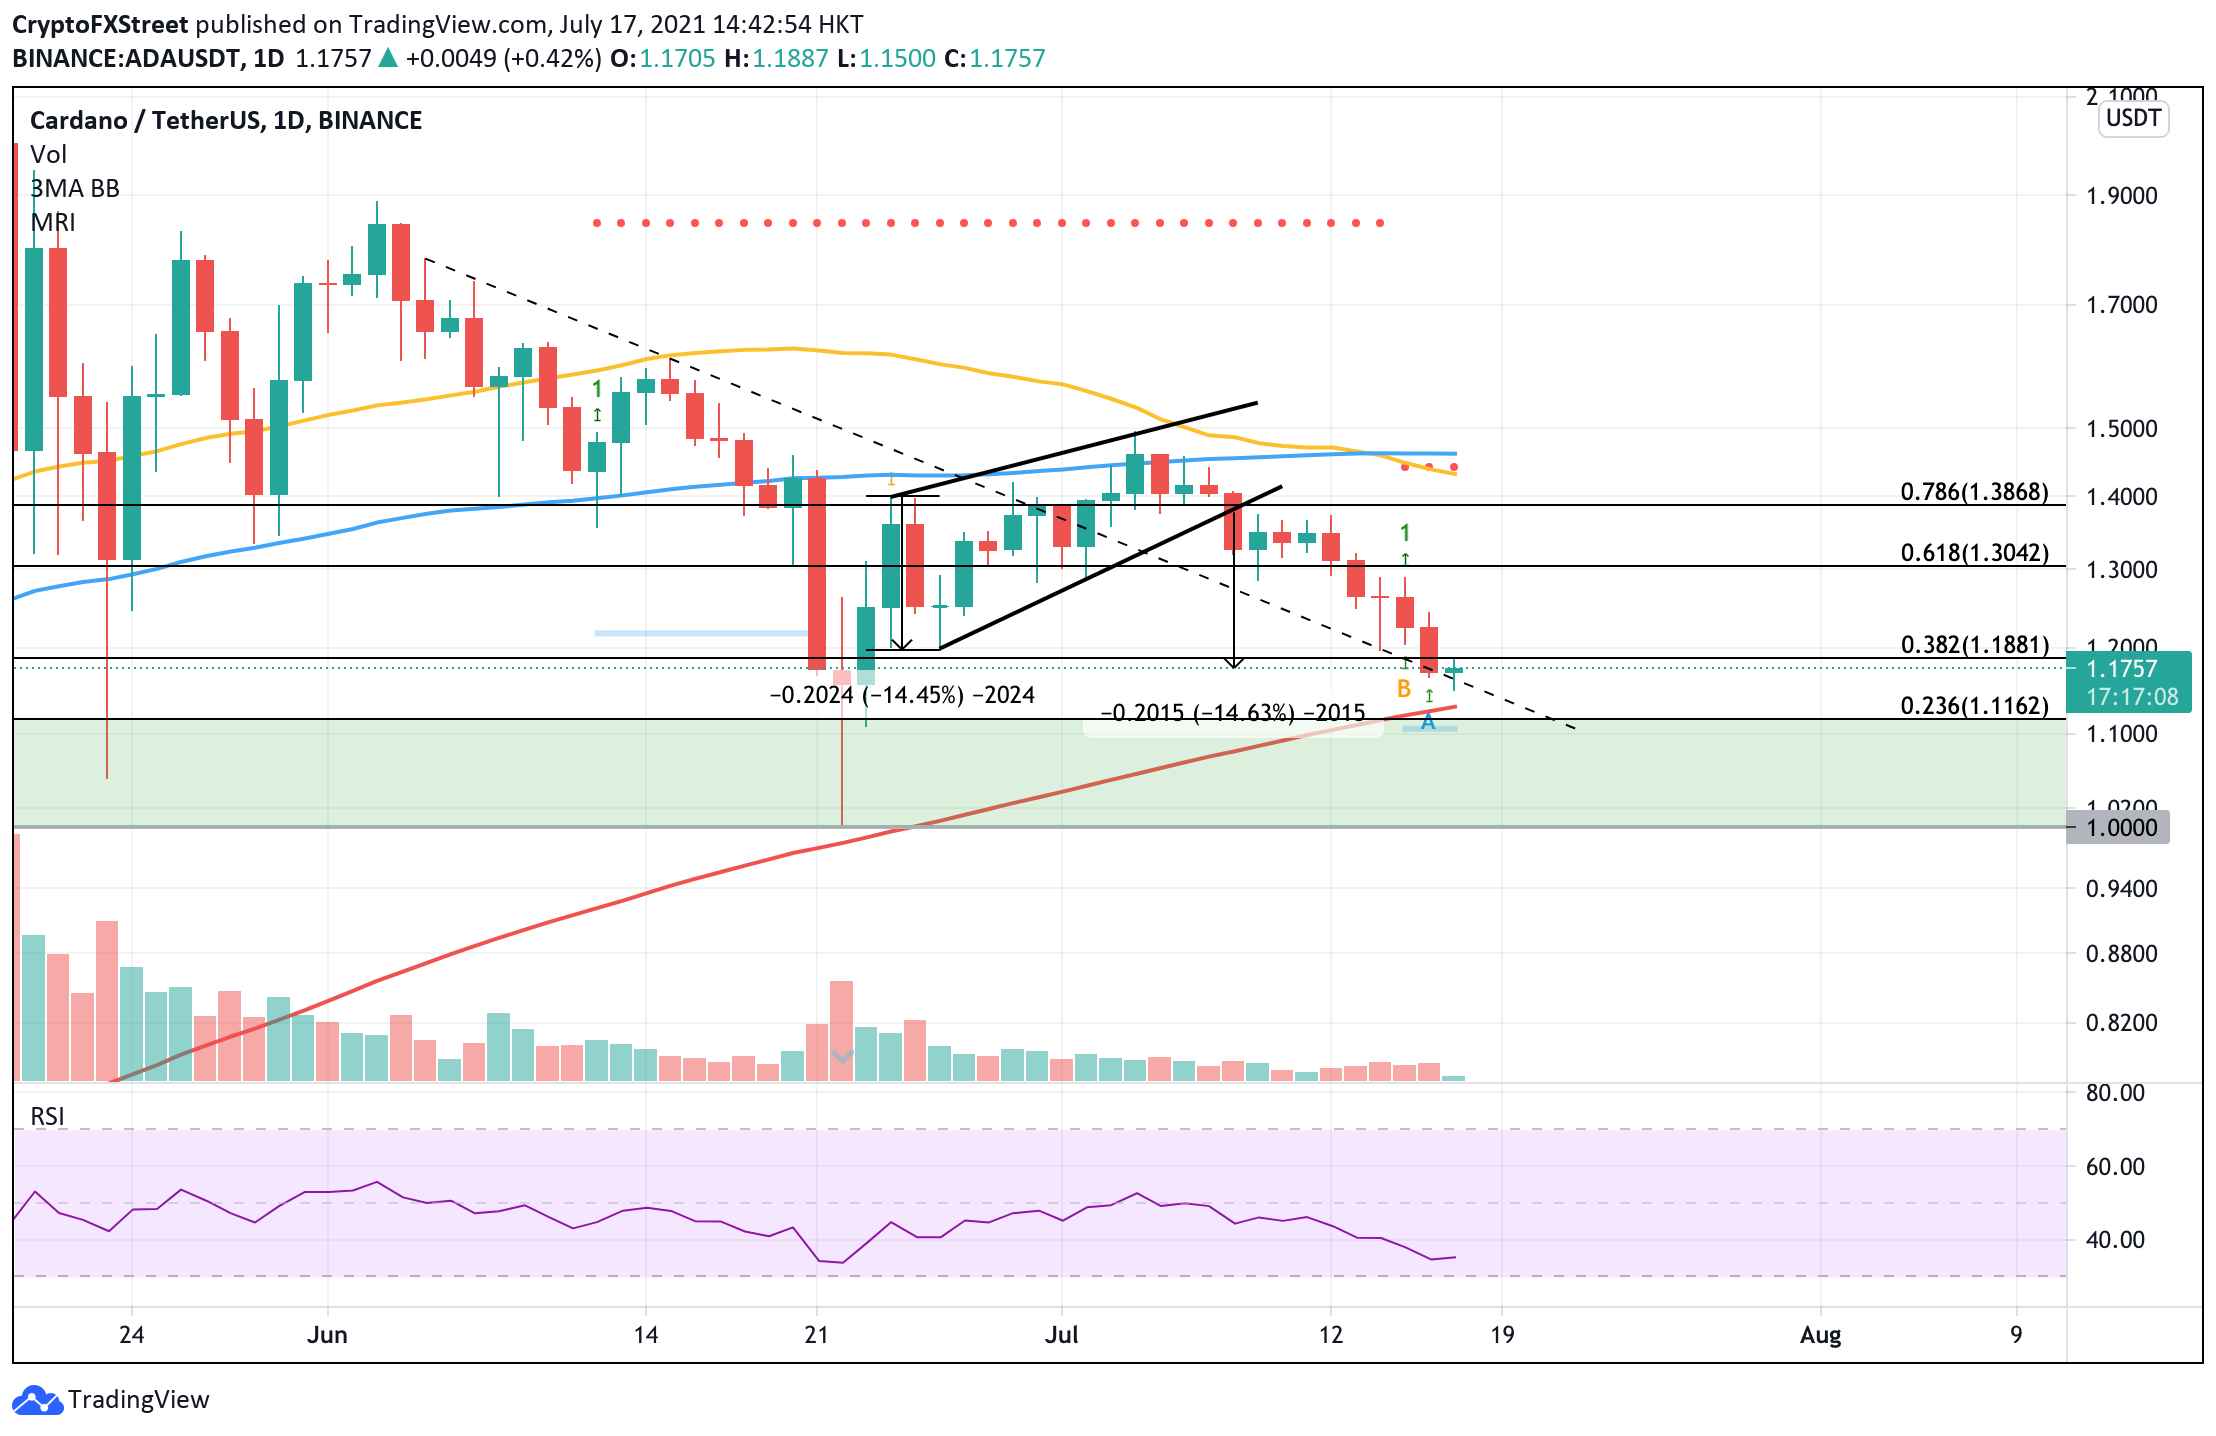
ADA/USDT daily chart
Should ADA buying pressure see an increase, Cardano price could aim at the 50-day Simple Moving Average (SMA) at $1.44, coinciding with the resistance line given by the MRI. However, this bullish target would only be in effect if it is able to overcome the 78.6% Fibonacci extension level at $1.38.
Currently, Cardano has printed a doji daily candlestick, indicating general equilibrium between buyers and sellers.
Cardano price will discover meaningful support at the 200-day SMA at $1.12. If ADA continues to lose steam, it could slice below the declining line of defense, falling further to retest the 23.6% Fibonacci extension level at $1.11.
A sharp spike in selling pressure would force Cardano into the demand zone, with a maximum bottom target at $1 for the time being.
Author

Sarah Tran
Independent Analyst
Sarah has closely followed the growth of blockchain technology and its adoption since 2016.


