Cardano price stuck in turbulence despite ADA’s Alonzo White hardfork
- Cardano price is down 8.5% this week, building on last week’s drop below the influential 2018 high of $1.40.
- ADA is slowly approaching the 200-day simple moving average (SMA), a point of support on June 22.
- Alonzo White hard fork successfully deployed, upgrading the Alonzo testnet.

Cardano price has not shown any conviction since the brief spike off the June 22 low, putting ADA investors on the defensive and exposing the green token to more significant losses if the selling gains traction. The only credible support level within the current price range is the 200-day SMA at $1.12. Still, the oversold reading on the 6-hour Relative Strength Index (RSI) may temporarily interrupt the selling.
Alonzo White hard fork builds the momentum to smart contract functionality
In a series of tweets posted on July 15, Input Output Hong Kong (IOHK) said that the Cardano network “is happily making blocks already.”
HARD FORK SUCCESSFUL: Delighted to report around 19.44 UTC today we successfully forked the #Alonzo testnet to the new #AlonzoWhite node. The new network is happily making blocks already. 1/5
— Input Output (@InputOutputHK) July 14, 2021
It is a significant step forward for Cardano in its pursuit of full smart contract functionality. It would introduce exciting changes to the network, including the capacity to host the increasingly popular decentralized finance (DeFi) applications.
Smart contracts are contracts that automatically execute once a set of conditions has been met. Additionally, they permit engineers to perform various functions on the blockchain, including sending information and documents. For example, in DeFi applications, buyers and sellers can exchange capital or assets without a broker.
Experts and Cardano enthusiasts anticipate that the hard fork coupled with future releases notably improves the potential and utility of ADA.
In the video below, IOHK CEO and co-founder Charles Hoskinson spoke about the Alonzo White hard fork and made statements on the Alonzo testnet and development in general.
Cardano price has entered a turbulence zone
The resolution of the bearish rising wedge on July 8 marked the beginning of a new decline for Cardano price following several days of trying to hold the 2018 high of $1.40. The drop placed ADA in a zone of turbulence defined by the 2018 high and the 61.8% Fibonacci retracement level of the 2020-2021 advance at the psychologically important $1.00. The 200-day SMA intervenes in the zone at $1.12.
The measured move target price is the low of the rising wedge at $0.99, yielding a 29% loss from the trigger price and a 20% move from the current price. To confirm the bearish outcome for ADA, Cardano price needs to log a daily close below the July 1 low of $1.21, something that it has not accomplished over the last two days, despite intra-day sweeps below the level.
A significant development during this ADA decline is the oversold reading on the 6-hour RSI on July 13. The resulting rebound has been passive, but it is essential to mention that the last time the RSI marked an oversold reading was on June 22, right before Cardano price began a rally to $1.40. In fact, the reading of 23.45 on the RSI was the lowest since late September 2020, the low of a multi-month cup base that ignited the rally into May.
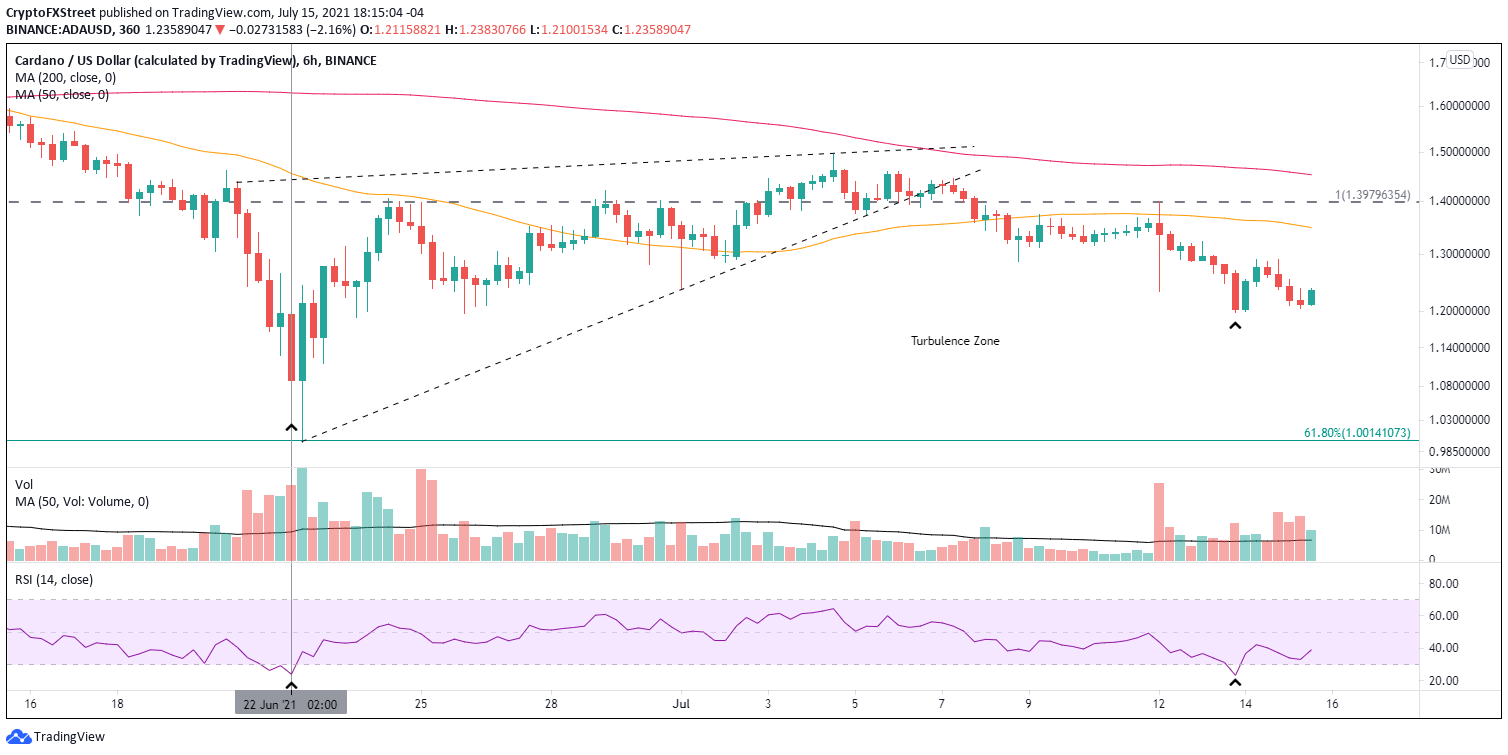
ADA/USD 6-hour chart
A push to the measured move target price of $0.99 would be questioned if Cardano price can print a daily close above $1.29. It would confirm the low established on July 13. Of course, a bullish forecast cannot be considered until ADA closes above $1.40.
Despite the obvious positive implications for the network, the Alonzo White hard fork has not moved the needle in terms of Cardano price. Instead, ADA continues to trade in a price zone, vulnerable to the turbulence dictated by the broader cryptocurrency market.
Here, FXStreet's analysts evaluate where ADA could be heading next as it seems range-bound.
Author

Sheldon McIntyre, CMT
Independent Analyst
Sheldon has 24 years of investment experience holding various positions in companies based in the United States and Chile. His core competencies include BRIC and G-10 equity markets, swing and position trading and technical analysis.



