Cardano Price Prediction: ADA nurtures the uptrend eyeing new record high
- Cardano seems to have begun another technical breakout toward $1.56.
- The IOMAP chart reveals ADA has a relatively smooth path, adding credence to the uptrend.
- The MACD cross also reinforces the bullish narrative.
- A daily close under the 100 SMA might result in a breakdown back to $1.

Cardano has recently come out of a technical pattern resistance, and bulls are fighting to sustain the breakout. Over the last couple of weeks, ADA has comparatively been in consolidation. The breakout above the symmetrical triangle pattern points ADA toward a new record high at $1.56.
Cardano’s uptrend supported by improving on-chain levels
The IOMAP by IntoTheBlock reveals that ADA is moving toward a relatively smooth path. The absence of robust resistance zones could validate the breakout to a new all-time high. However, the model brings our attention to the region running from $1.15 and $1.18. Here, 38,250 addresses had previously bought roughly 2.1 billion ADA. Trading above this zone could see ADA continue with the uptrend.
Cardano is also sitting on top of an area with immense support. The area between $1.11 and $1.15 is the most robust buyer congestion zone. It is highlighted by the nearly 147,000 addresses that had previously purchased approximately 5.1 billion ADA.
-637509490922145616.png)
Cardano IOMAP chart
The 4-hour chart brings a symmetrical triangle pattern to light, whose breakout targets a 34% upswing to $1.56. The pattern formed amid the consolidation witnessed in the past two weeks. Despite trading above the upper trendline, Cardano is struggling with sustaining the uptrend. However, closing the day above the Simple Moving Average will add credence to the bullish outlook.
Similarly, the Moving Average Convergence Divergence (MACD) has a bullish impulse. If the MACD line (blue) crosses above the signal line, the upswing to $1.56 will gradually be validated.
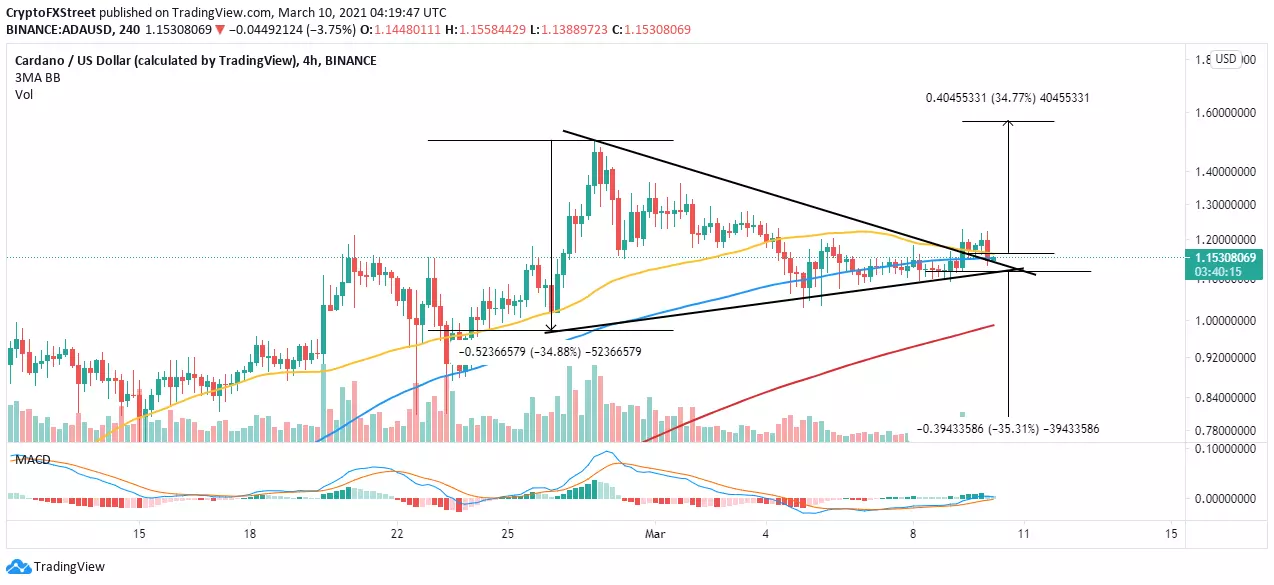
ADA/USD 4-hour chart
Looking at the other side of the fence
If Cardano closes the day under the 50 SMA and the 100 SMA, we can expect overhead pressure to rise. Moreover, return into the symmetrical triangle could be a bearish signal, likely to culminate in massive losses under the lower trendline. Besides, ADA is not out of the woods owing to the resistance at the 50 SMA.
Author

John Isige
FXStreet
John Isige is a seasoned cryptocurrency journalist and markets analyst committed to delivering high-quality, actionable insights tailored to traders, investors, and crypto enthusiasts. He enjoys deep dives into emerging Web3 tren