Cardano Price Forecast: ADA moves closer to colossal rally eyeing $2
- Cardano is trading at that apex of a symmetrical triangle as a massive breakout lingers.
- A break above the 50 SMA on the 4-hour chart will add weight to the expected upswing.
- The slump in network growth could hamper the bullish outlook and delay the breakout.

Cardano is in the middle of consolidation following a breakdown from the all-time high at $1.49. Support established at $1 allowed bulls to focus on recovery. Meanwhile, ADA is nearing a critical breakout point, likely to see it hit $2.
Cardano technical breakout around the corner
The formation of a symmetrical triangle pattern on the 4-hour chart brings to light a potentially massive breakout to $2. These triangles do not have a bearish or a bullish bias and are created by connecting trendlines. One trendline links a series of decline peaks while the other links a series of ascending lows.
A breakout from the triangle is expected when the price slices through the upper trendline. On the other hand, a breakdown occurs when the price tumbles below the lower trendline. Triangles have precise targets measured from the highest to the lowest points.
Currently, Cardano is likely to make a breakout from the triangle, followed by a 68% upswing to $2. Besides, trading above the 50 Simple Moving Average (SMA) will validate the bullish outlook.
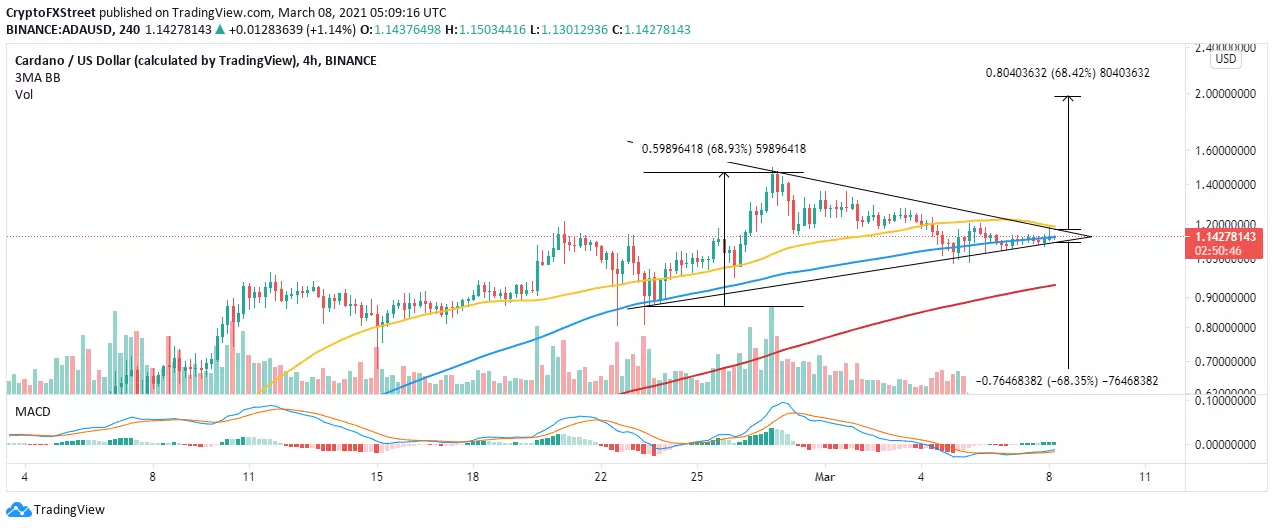
ADA/USD 4-hour chart
The Bollinger Bands have reinforced the ongoing consolidation. Cardano has also settled above the middle boundary as bulls fight for a breakout. The squeezing bands hint at a breakout in the near term.
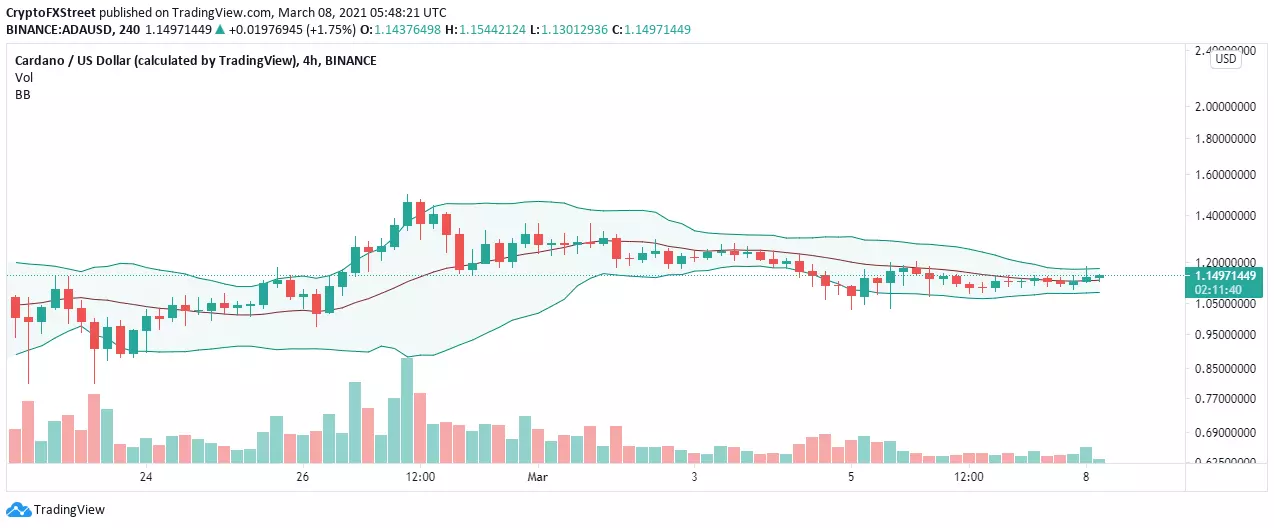
ADA/USD 4-hour chart
Looking at the other side of the fence
According to IntoTheBlock, Cardano is currently dealing with decreasing network growth. In other words, the number of newly-created addresses has been decreasing since it topped out at nearly 73,000 on February 20. At the time of writing, unique addresses joining ADA stand at roughly 18,000, representing a 75% downswing.
-637507802824732208.png)
Cardano network growth
It is worth keeping in mind that a slow or declining network growth is a bearish signal. The decrease interferes with the normal token inflow and outflow. Simultaneously, it shows that mainstream adoption is going down, hence hampering both price and network growth.
Author

John Isige
FXStreet
John Isige is a seasoned cryptocurrency journalist and markets analyst committed to delivering high-quality, actionable insights tailored to traders, investors, and crypto enthusiasts. He enjoys deep dives into emerging Web3 tren


