Cardano Price Forecast: ADA tumbles toward monthly lows as retail demand falters
- Cardano extends its decline toward the December low of $0.37 amid risk-off sentiment across the broader crypto market.
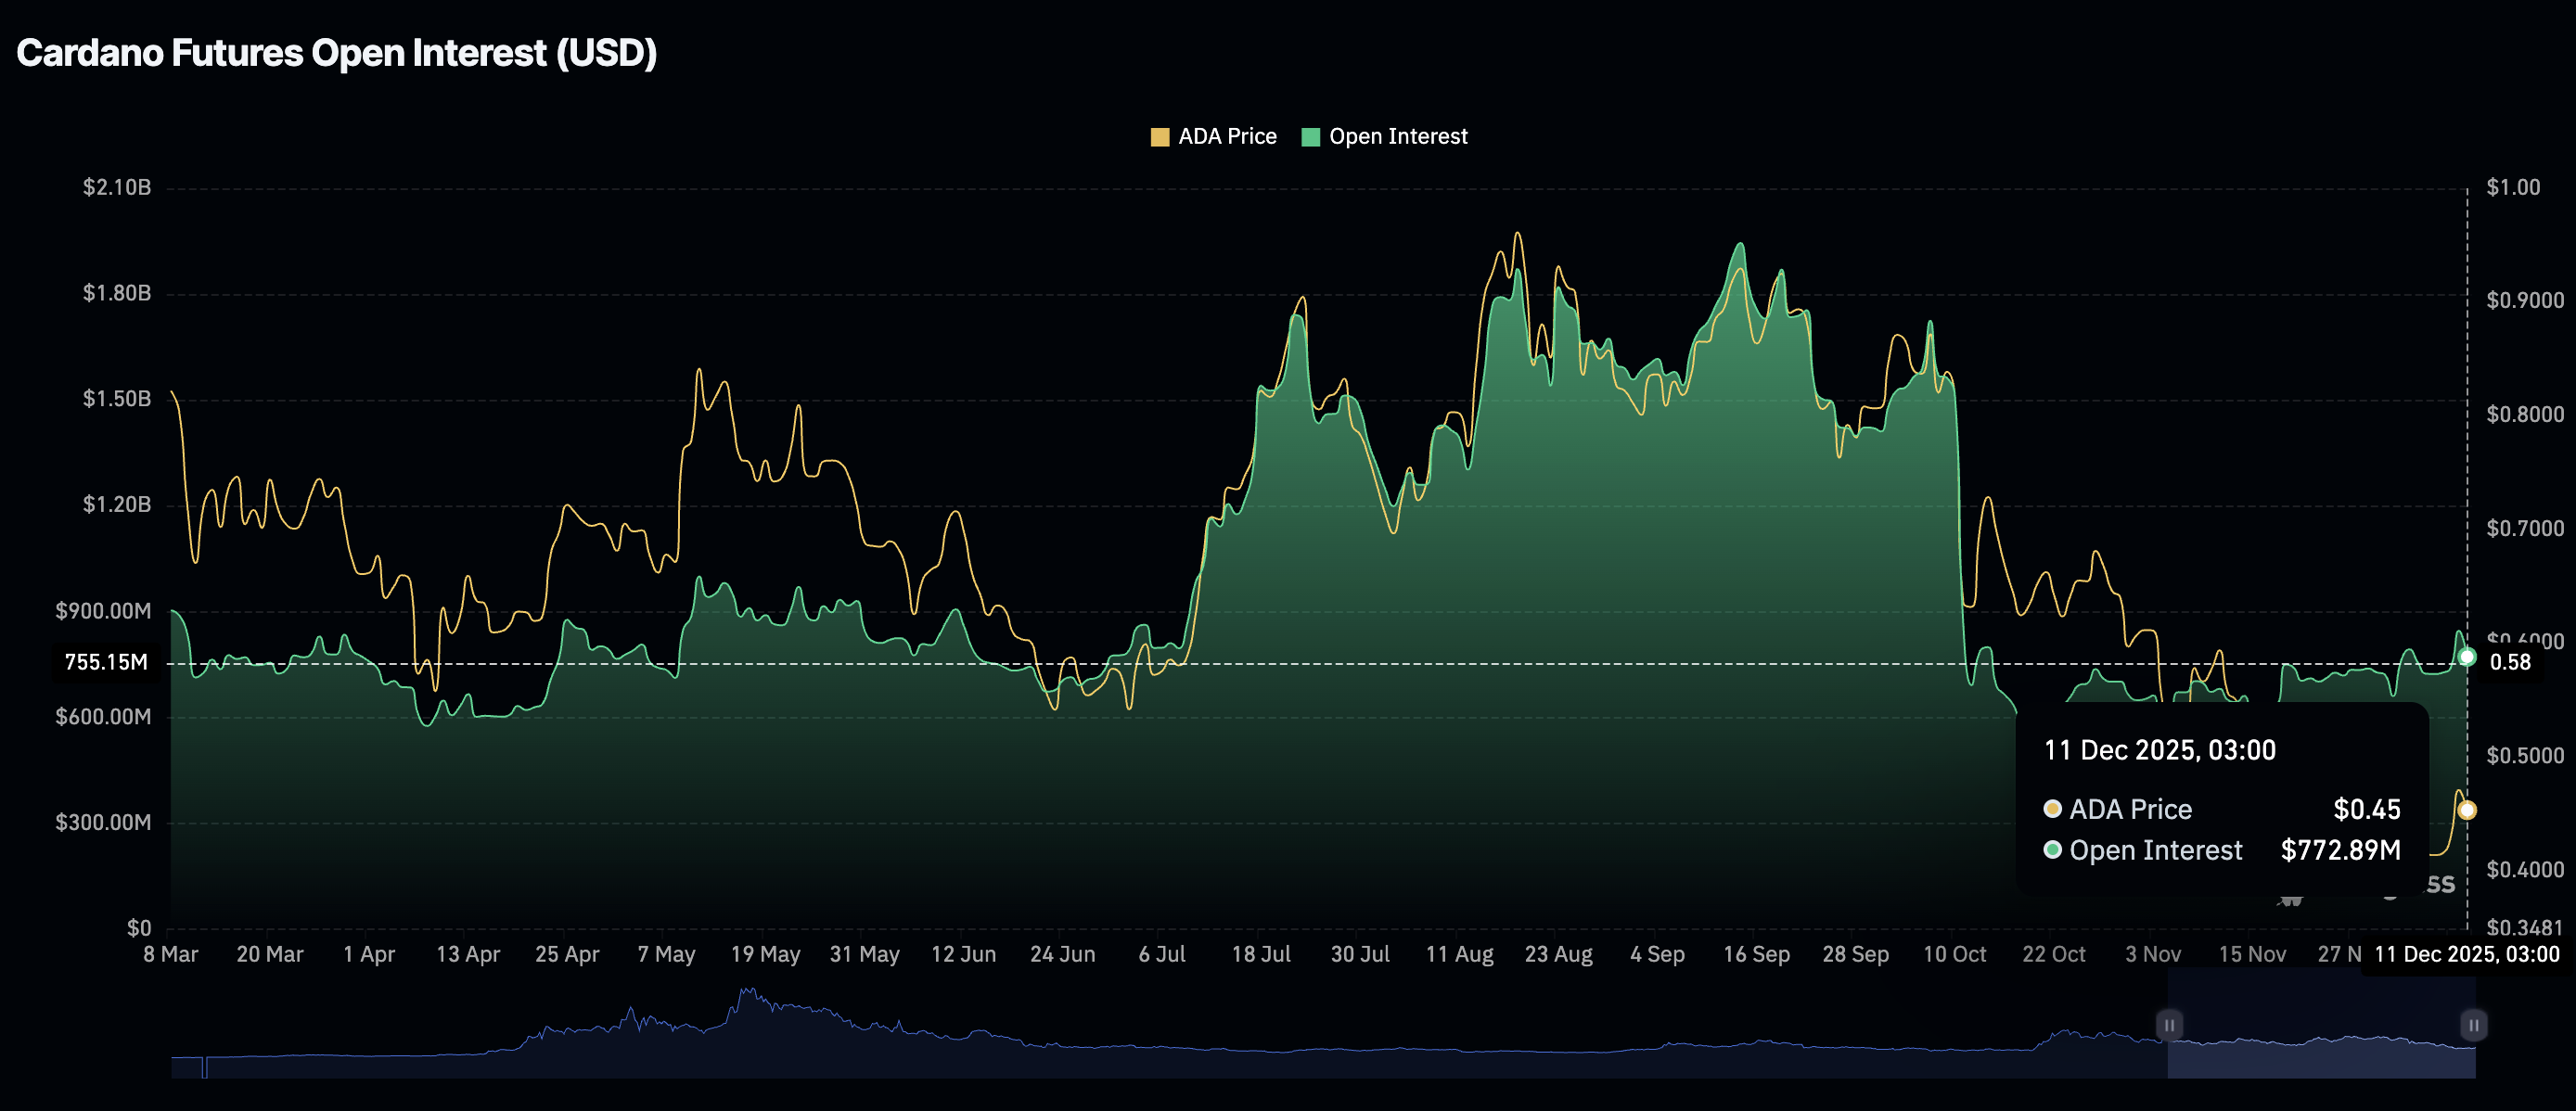
- Retail demand dips with futures Open Interest at $773 million, down from the $1.95 billion record high.
- A MACD buy signal suggests that buyers have a slight edge, but the 50-day EMA limits ADA's upside.

Cardano (ADA) is extending its decline and approaching the pivotal $0.40 level at the time of writing on Thursday. The sell-off occurs despite the Federal Reserve (Fed) decision to ease monetary policy, which dampened sentiment across the crypto market due to the rising uncertainty about the easing path in 2026.
Despite the Fed cutting its benchmark lending rate by 25 basis points to a range of 3.50%-3.75% on Wednesday, the overall outlook remained hawkish, with Jerome Powell, the central bank's Chairman, highlighting upside inflation risks and a slow labor market as factors that could support fewer rate cuts in the coming year.
Cardano and other riskier assets may remain largely in the hands of the sellers until the dust settles and the crypto market finds other catalysts to steer prices north.
Cardano faces declining retail interest
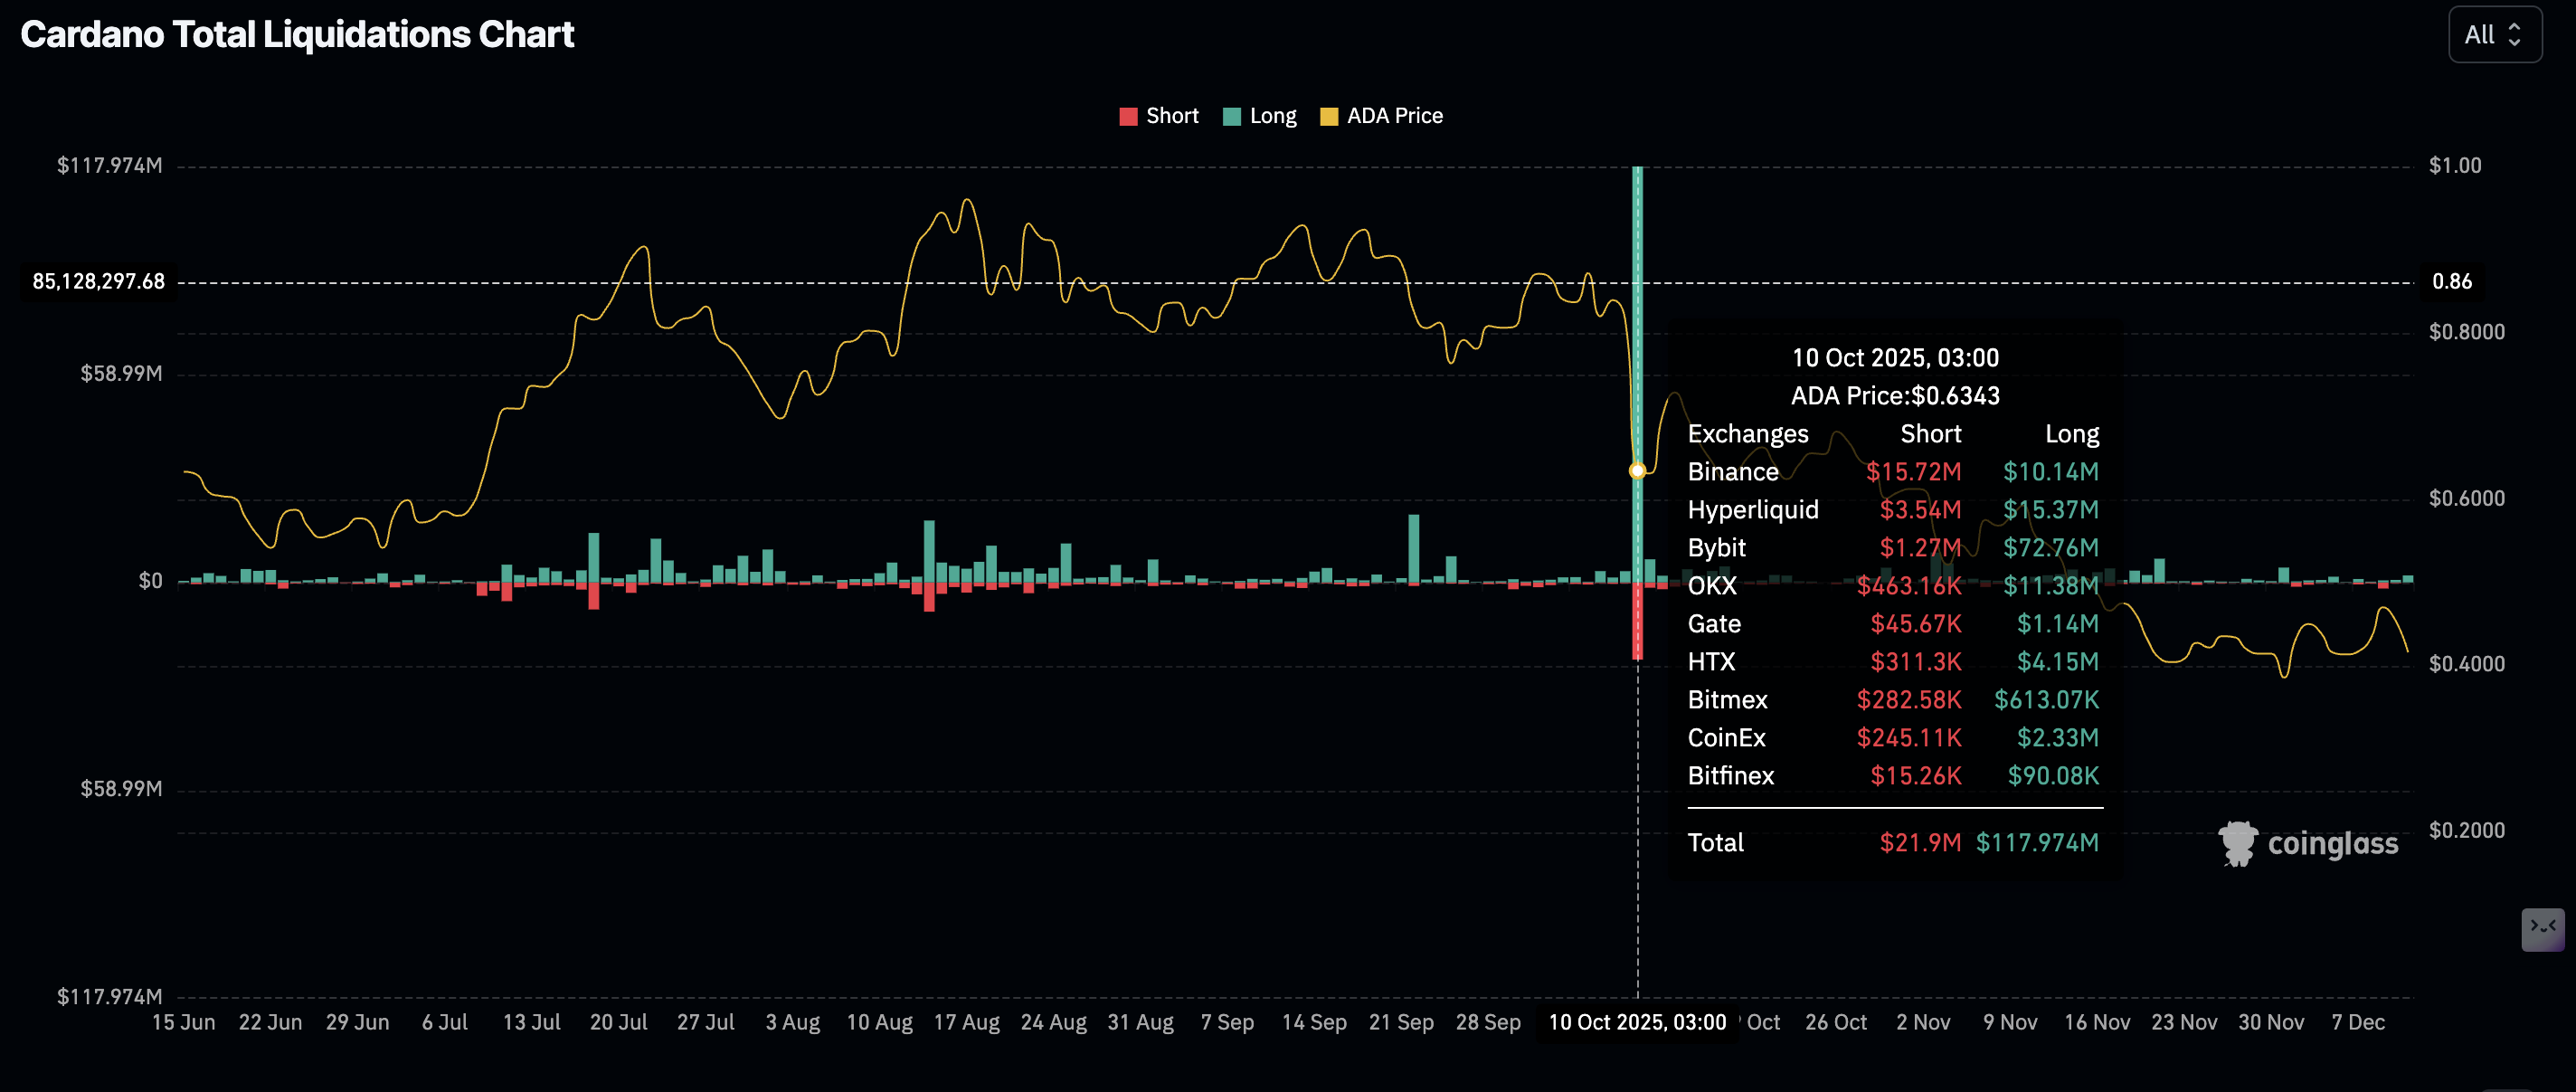
The Cardano derivatives market has not recovered since the October 10 sell-off, which liquidated nearly $118 million in related long positions and $22 million in shorts. The broader cryptocurrency market lost approximately $19 billion in single-day liquidations, significantly dampening sentiment.
Retail demand for Cardano derivatives has been on the back foot since the deleveraging event, with futures Open Interest (OI) averaging $773 million on Thursday, down from $847 million the previous day. Looking back, OI stood at $1.51 billion on October 10, with the record high at $1.95 billion on September 14. OI should steadily increase to support sentiment, attract retail interest, and bolster the uptrend.
Technical outlook: Cardano bears tighten their grip
Cardano is trading at $0.41, after falling by over 9% below the $0.43 open. The smart contracts token also sits under the 50 Exponential Moving Average (EMA) at $0.434, the 100 EMA at $0.437 and the 200-EMA at $0.47 on the 4-hour chart. Moreover, the 50-EMA is rolling over beneath the 100-EMA, reinforcing a bearish outlook.
The Moving Average Convergence Divergence (MACD) indicator slips below its signal line (red) and into negative territory, with deepening negative histogram bars suggesting strengthening bearish momentum. The Relative Strength Index (RSI) prints 37 (bearish), but not oversold. Failure of the RSI to stabilize above the midline would keep sellers engaged. A descending trend line from $0.60 limits the recovery, with resistance seen near $0.47.
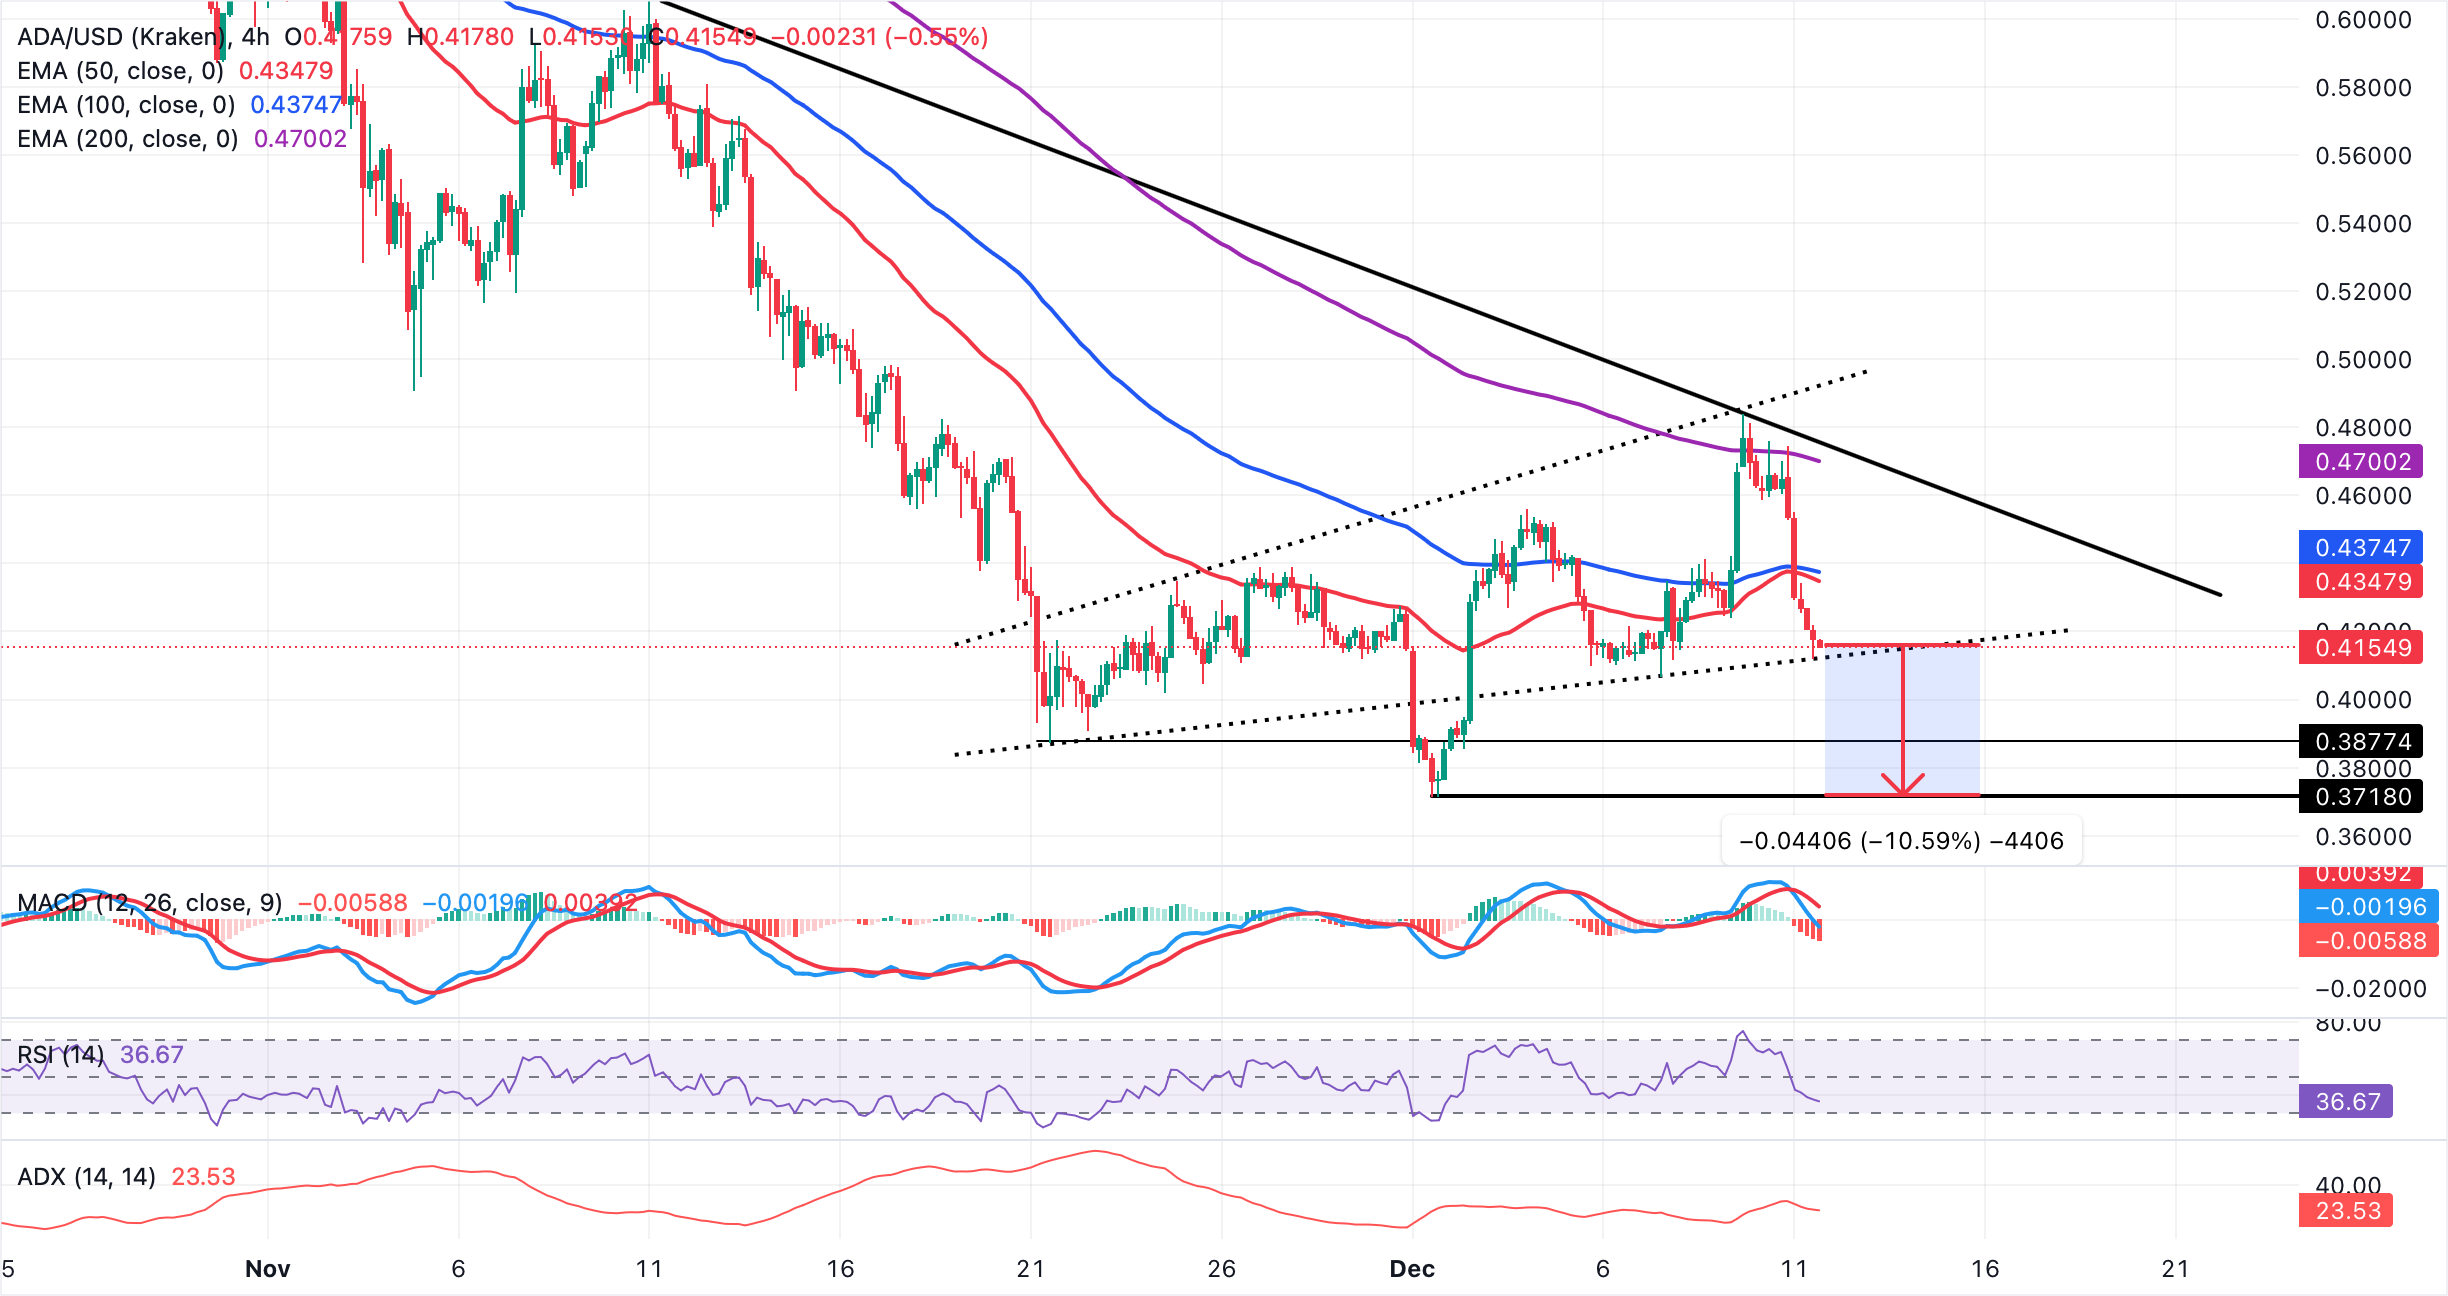
Cardano's downward trend's strength is moderate, as the Average Directional Index (ADA) hovers near 24 after easing from recent highs. If buyers reclaim the 50 and 100 EMAs at$0.43, upside attempts could extend toward the 200 EMA near $0.47, while repeated failure below that band would maintain a downside bias towards the December low of $0.37.
Open Interest, funding rate FAQs
Higher Open Interest is associated with higher liquidity and new capital inflow to the market. This is considered the equivalent of increase in efficiency and the ongoing trend continues. When Open Interest decreases, it is considered a sign of liquidation in the market, investors are leaving and the overall demand for an asset is on a decline, fueling a bearish sentiment among investors.
Funding fees bridge the difference between spot prices and prices of futures contracts of an asset by increasing liquidation risks faced by traders. A consistently high and positive funding rate implies there is a bullish sentiment among market participants and there is an expectation of a price hike. A consistently negative funding rate for an asset implies a bearish sentiment, indicating that traders expect the cryptocurrency’s price to fall and a bearish trend reversal is likely to occur.
(The technical analysis of this story was written with the help of an AI tool)
Author

John Isige
FXStreet
John Isige is a seasoned cryptocurrency journalist and markets analyst committed to delivering high-quality, actionable insights tailored to traders, investors, and crypto enthusiasts. He enjoys deep dives into emerging Web3 tren



