Cardano Price Forecast: ADA profit-taking and dormant wallet activity rise as BTC dips below $100K
- Cardano price falls nearly 15% weekly as Middle East tensions escalate following the US’s attack on Iran.
- The price drop in ADA wiped out nearly $17 million in long positions last week.
- On-chain data indicate that ADA profit-taking and dormant wallet activity are increasing, signaling growing selling pressure.

Cardano (ADA) price hovers around $0.54 on Monday, after falling nearly 15% last week, as tensions in the Middle East escalated following the US attack on Iran. This double-digit correction triggered a wave of liquidation, wiping out a total of nearly $17 million in long positions last week. Additionally, the on-chain metrics support the bearish thesis as ADA profit-taking and dormant wallet activity are increasing, signaling growing selling pressure.
Cardano price weakens as the US attacks Iran, rising global tensions
Cardano price action shows weakness as tensions in the Middle East rise. The Iran-Israel war that has been taking place for more than a week escalates as the US attacks Iran late Saturday.
US President Donald Trump announced that three nuclear facilities in Iran were attacked.

This geopolitical conflict has triggered a risk-off sentiment in the global markets, with Bitcoin reaching a low of $98,200 on Sunday, followed by Cardano reaching levels not seen since early February.
Examining the CoinGlass liquidation chart for Cardano shows that a total of nearly $17 million in long positions were liquidated over a week, as the Middle East conflicts sparked risk aversion.
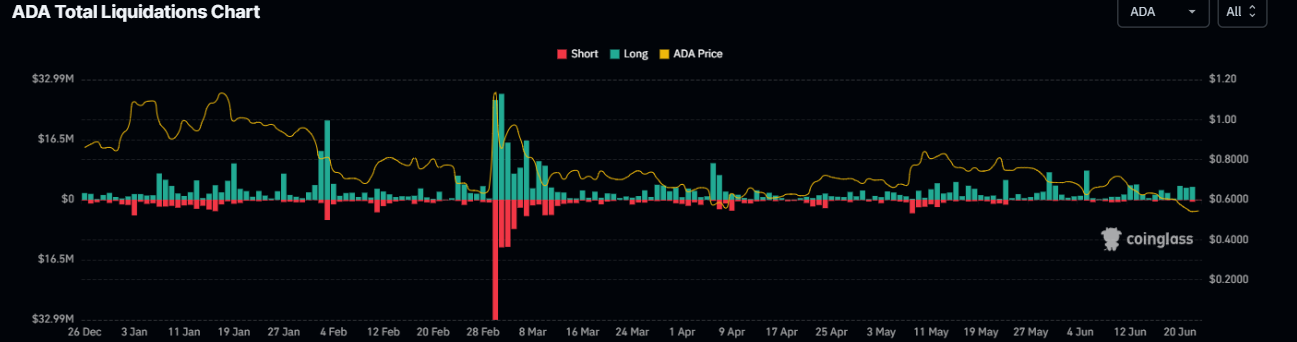
ADA total liquidation chart. Source: Coinglass
Cardano’s on-chain metrics show a bearish bias
Santiments’ Network Realized Profit/Loss (NPL) metric indicates that ADA holders are booking some profit.
As shown in the graph below, the NPL experienced a significant spike on June 16, reaching its highest level since early March, and a similar, albeit less intense, spike on Friday. These spikes indicate that holders are, on average, selling their bags at a significant profit and increasing the selling pressure.
 [09-1750654901931.05.04, 23 Jun, 2025].png)
Cardano NPL chart. Source: Santiment
Examining Santiments' Age Consumed index also shows bearish signs. The spikes in this index suggest dormant tokens (tokens stored in wallets for a long time) are in motion, and it can be used to spot short-term local tops or bottoms. As in the case of Cardano, history shows that a decline followed the spikes in ADA’s price as holders moved their tokens from wallets to exchanges, thereby increasing selling pressure. The most recent uptick on Friday forecasted that ADA was ready for a downtrend.
 [09-1750654932423.05.42, 23 Jun, 2025].png)
Cardano Age Consumed chart. Source: Santiment
Cardano Price Forecast: ADA hits its lowest level since early February
Cardano price faced rejection from its 200-day Exponential Moving Average (EMA) on June 11. It crashed nearly 25% in the next 11 days until Sunday, reaching a low of $0.51, the lowest level since early February. Moreover, it also closed below the ascending trendline (drawn by connecting multiple lows since early November) last week, indicating a bearish trend. At the time of writing on Monday, it hovers at around $0.54.
If ADA continues its downward trend and closes below the weekly support at $0.49 on a daily basis, it could extend the decline toward its next daily support at $0.45.
The Relative Strength Index (RSI) read 26 and reflects an oversold condition, indicating strong bearish conditions. However, the chances of recovery are high as RSI reaches oversold conditions. Moreover, the Moving Average Convergence Divergence (MACD) on the daily chart showed a bearish crossover. It also displays a rising red histogram bar below its neutral level, indicating bearish strength and suggesting the continuation of a downward trend.
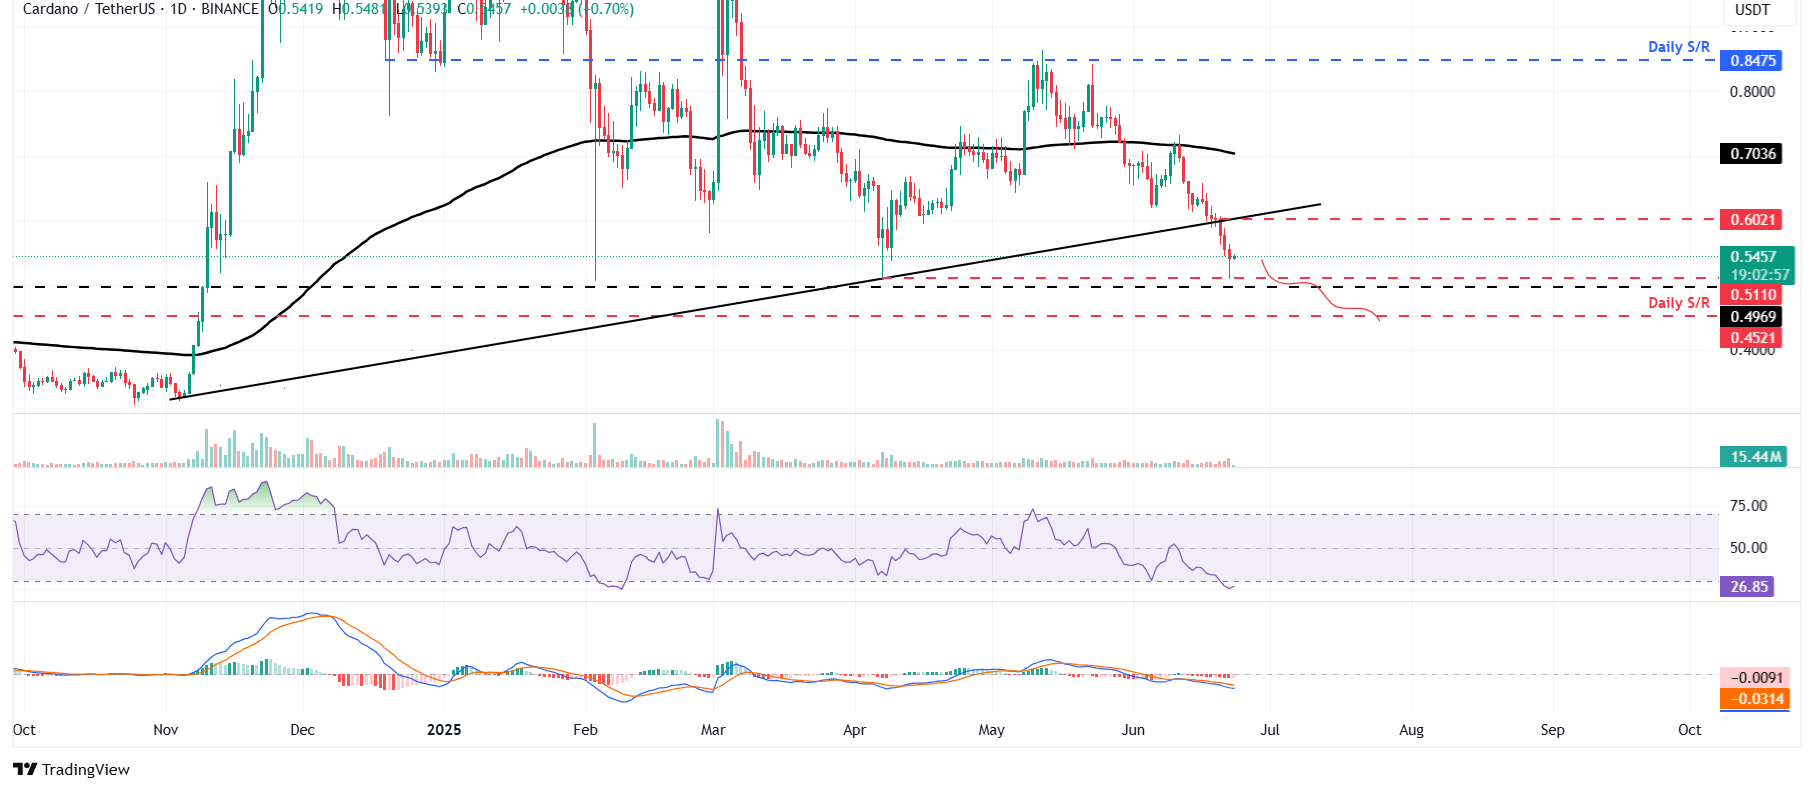
ADA/USDT daily chart
However, if ADA recovers, it could extend the recovery toward its previous broken trendline level at $0.60.
Author

Manish Chhetri
FXStreet
Manish Chhetri is a crypto specialist with over four years of experience in the cryptocurrency industry.



