Cardano Price Forecast: ADA on the verge of correction as momentum weakens
- Cardano price hovers around its key support at $0.72 on Tuesday; a close below could trigger a correction.
- On-chain metrics support a bearish thesis as ADA daily active addresses and DEX trading volume are falling.
- The technical outlook suggests weakness in momentum and a double-digit fall ahead.

Cardano (ADA) trades in red on Tuesday at the time of writing, hovering around its key support level at $0.72. A decisive close below this level could trigger a correction. ADA’s falling daily active addresses and Decentralized Exchange (DEX) trading volume further support the bearish outlook. Adding to this, the technical outlook suggests weakness in momentum and a double-digit fall.
Cardano’s on-chain metrics show a bearish bias
Santiment’s Daily Active Addresses index, which tracks network activity over time, paints a bearish picture for Cardano. A rise in the metric signals greater blockchain usage, while declining addresses point to lower demand for the network.
In ADA’s case, Daily Active Addresses fell to 23,644 on Tuesday from 35,696 on May 14, extending a downtrend that started in early March. This indicates that demand for ADA’s blockchain usage is decreasing, which doesn’t bode well for Cardano’s price.
 [13-1747728844857.21.25, 20 May, 2025].png)
Cardano’s active addresses chart. Source: Cardano
Crypto intelligence tracker DefiLlama data shows that Cardano’s chain DEX trading volume has constantly fallen since early December and currently reads $3.06 million on Tuesday. This fall in volume signaled decreased user activity and liquidity in the ADA blockchain, indicating a bearish outlook.
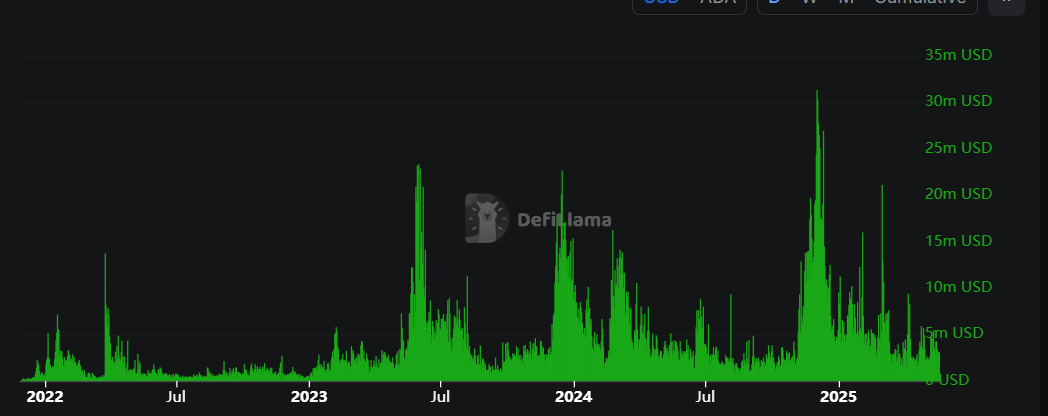
Cardano’s DEX trading volume chart. Source: DefiLama
Cardano Price Forecast: Momentum indicators show bearish signs
Cardano price faced rejection around the daily resistance at $0.84 on May 13 and declined 10% in the next four days. This daily level coincides with the 50% Fibonacci retracement ( drawn from the March 3 high of $1.17 to the April 7 low of $0.51) at $0.84, making this a key resistance zone. However, ADA retested and found support around its 200-day Exponential Moving Average (EMA) at $0.71 on Sunday. At the time of writing on Tuesday, it trades slightly down at around $0.73.
If ADA breaks and closes below the 200-day EMA at $0.71 on a daily basis, it could extend the decline by 12% from its current levels to retest its May 6 low of $0.64.
The Relative Strength Index (RSI) on the daily chart reads 49, slipping below the neutral level of 50, indicating increasing bearish momentum. The Moving Average Convergence Divergence (MACD) indicator also supports the bearish thesis as it showed a bearish crossover on Sunday, giving a selling signal and indicating a downward trend.
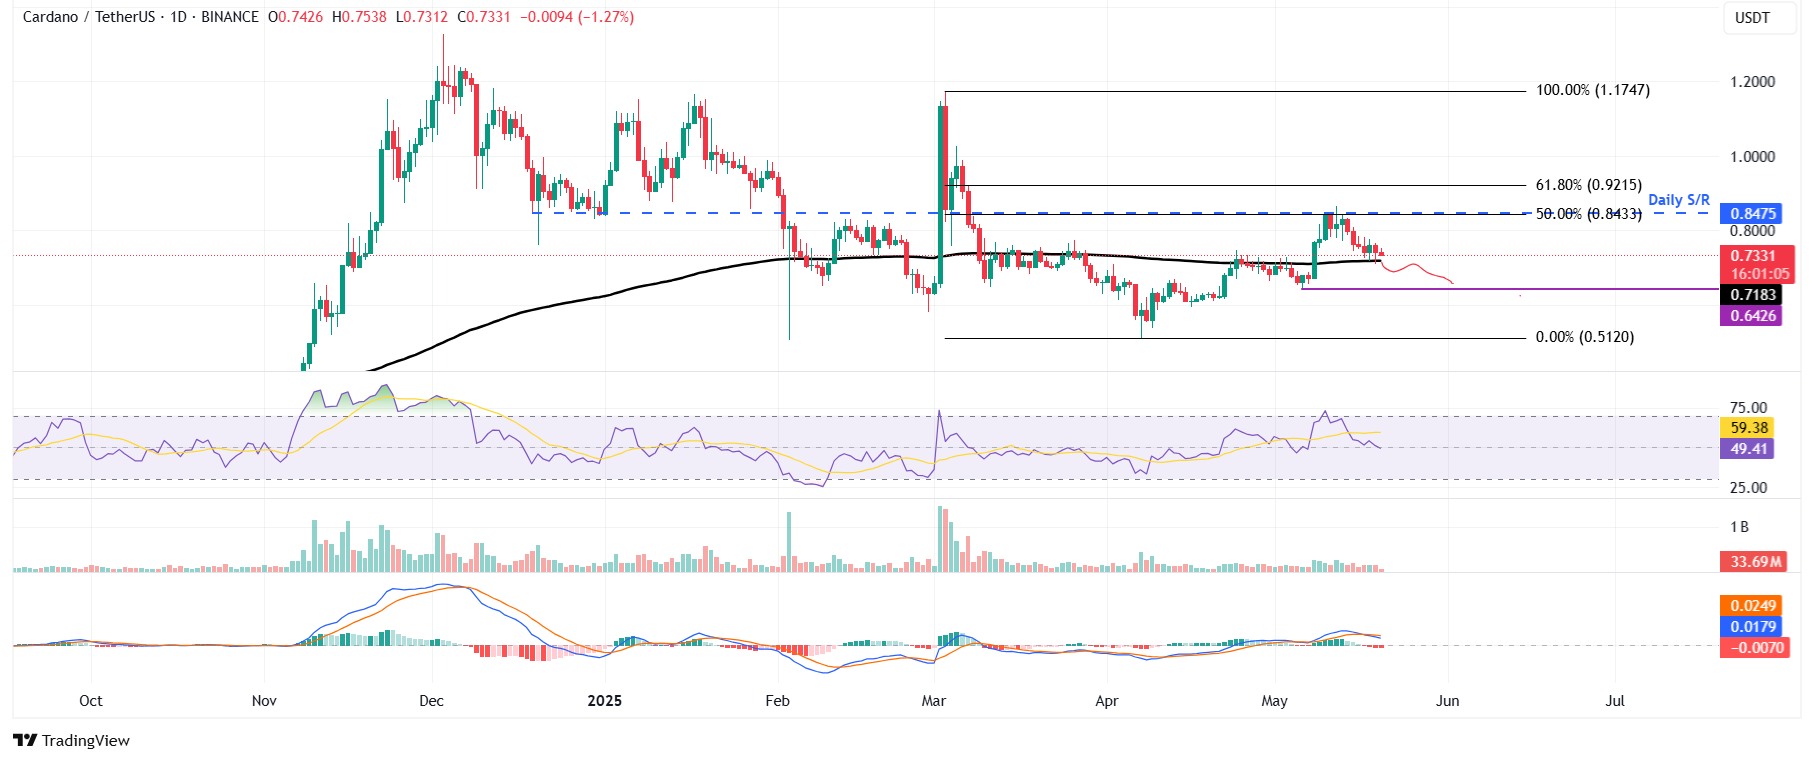
ADA/USDT daily chart
However, if Cardano finds support around the 200-day EMA at $0.71 and recovers, it could extend the recovery to retest its daily resistance at $0.84.
Author

Manish Chhetri
FXStreet
Manish Chhetri is a crypto specialist with over four years of experience in the cryptocurrency industry.



