Cardano Price Forecast: ADA drops below $0.60 as negative funding rates signal deeper downside ahead
- Cardano price trades in red on Friday, correcting nearly 10% so far this week.
- Bearish sentiment intensifies as ADA’s funding rates flip negative and its TVL continues to fall.
- The technical outlook points to further downside, with bears eyeing a potential drop below $0.50.

Cardano (ADA) price continues to trade in red around $0.52 at the time of writing on Friday after dropping more than 10% so far this week. The bearish outlook is further strengthened as ADA funding rates turn negative alongside a decline in Total Value Locked (TVL). On the technical side, it supports further correction, with bears aiming for levels below $0.50.
Cardano’s derivatives and on-chain data show bearish bias
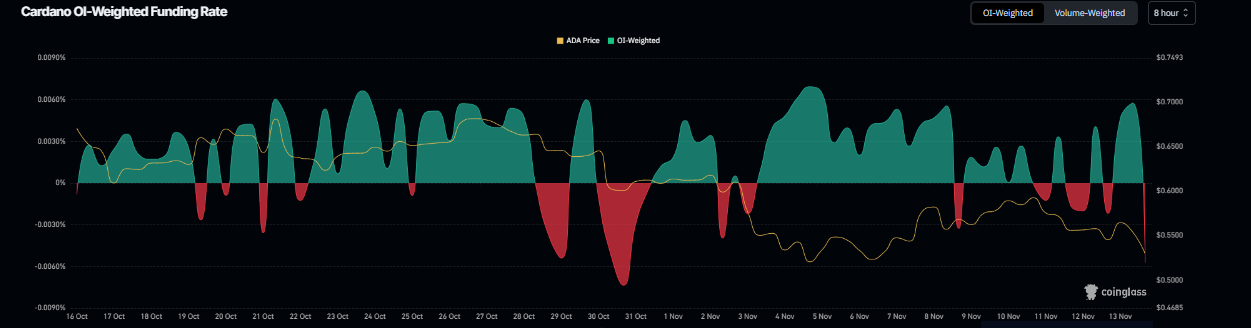
Derivatives data for Cardano support a bearish outlook. Coinglass’s OI-Weighted Funding Rate data shows that the number of traders betting that the price of ADA will slide further is higher than those anticipating a price increase.
The metric has flipped to a negative rate and stands at -0.057% on Friday, nearing the level seen during the end of October’s price dips. The negative ratio suggests that shorts are paying longs, suggesting bearish sentiment toward ADA.
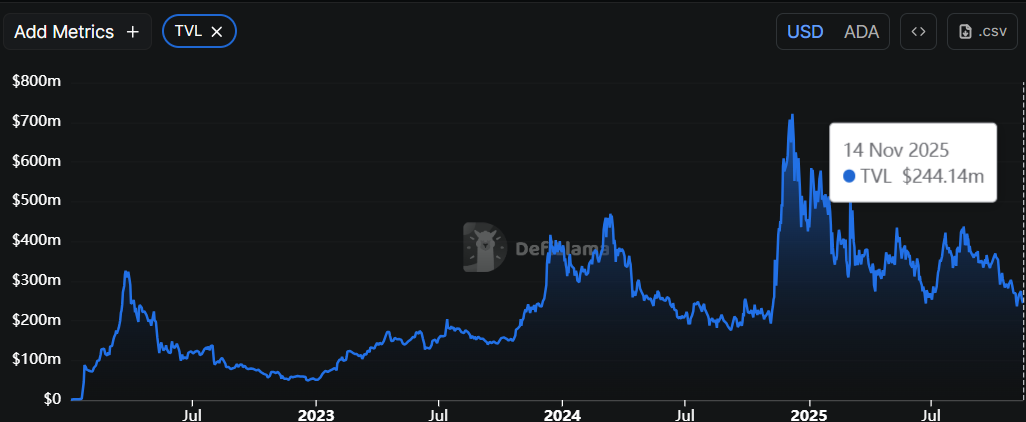
DefiLlama data shows that Cardano’s TVL dropped to $244.14 million on Friday and has been steadily declining since mid-August. Falling TVL signals weakening activity and waning user engagement in Cardano’s ecosystem, implying that fewer participants are depositing or interacting with ADA-based protocols, which doesn't bode well for its price.
Cardano Price Forecast: ADA risks drop below $0.50 mark
Cardano's price faced rejection at the 50% retracement level at $0.61 on Tuesday and declined by more than 10% until Thursday. At the time of writing on Friday, ADA is trading down at $0.52.
If ADA continues its correction, it could extend the correction toward the daily support level at $0.49.
The Relative Strength Index (RSI) reads 35, below its neutral level of 50, indicating bearish momentum gaining traction. Moreover, the Moving Average Convergence Divergence (MACD) lines are converging, with decreasing green histogram bars above the neutral level and suggesting an impending bearish crossover.
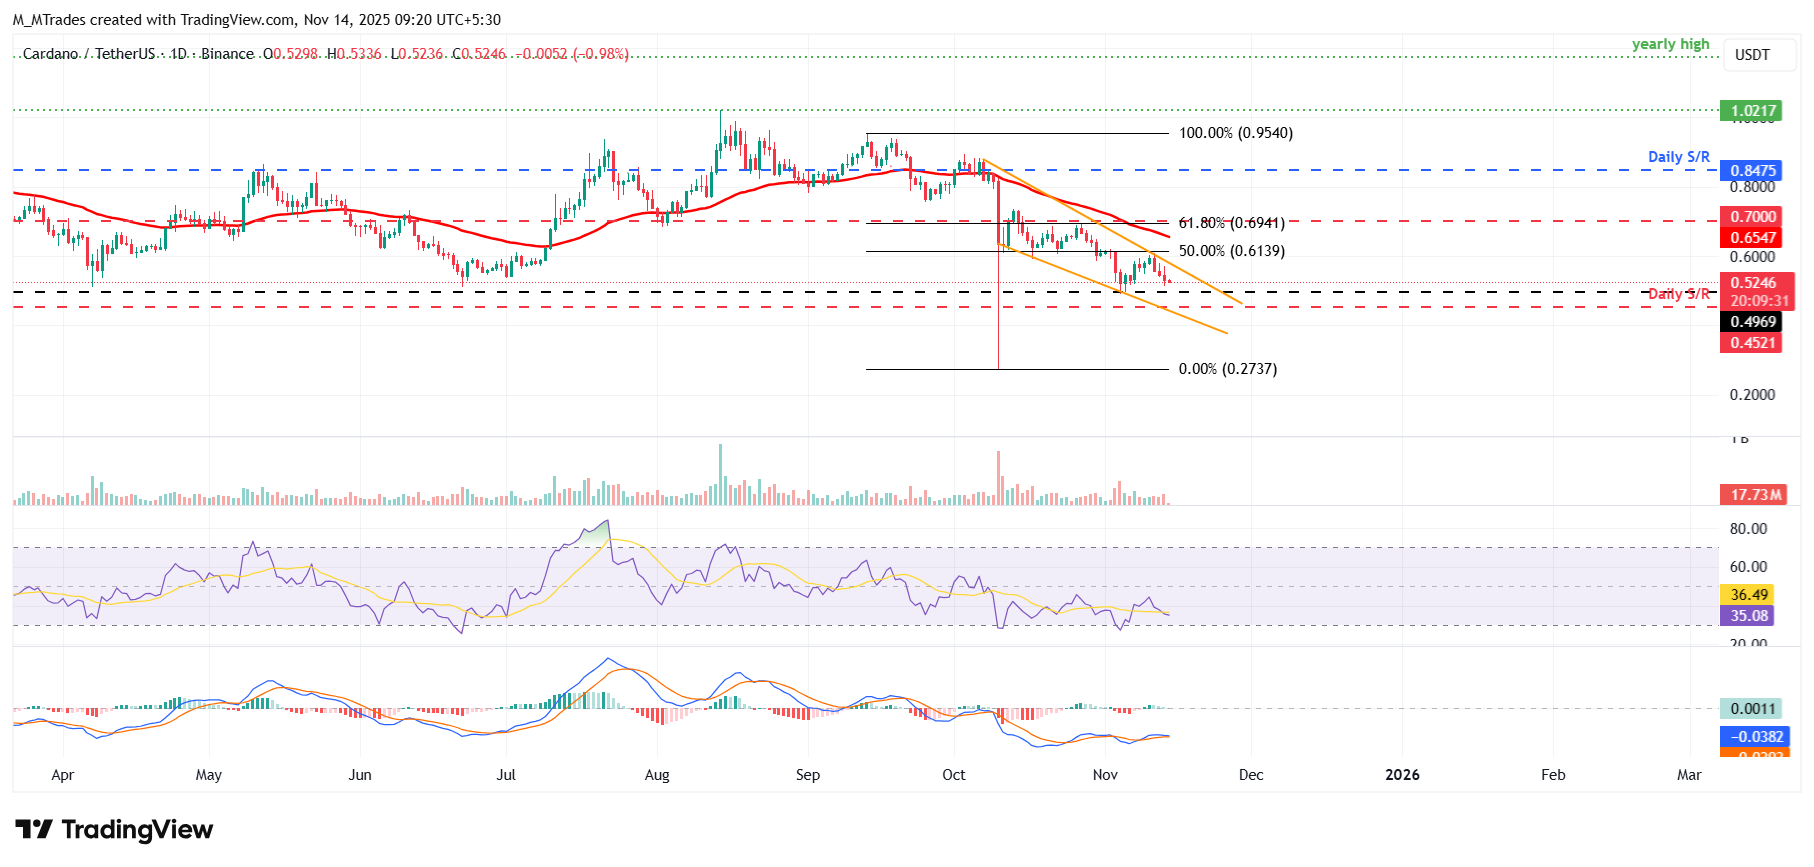
On the other hand, if ADA recovers, it could extend the recovery toward the key resistance at $0.61.
Author

Manish Chhetri
FXStreet
Manish Chhetri is a crypto specialist with over four years of experience in the cryptocurrency industry.



