Bitcoin Price Forecast: BTC consolidates near $102,800 as market indecision persists
- Bitcoin price hovers around $102,800 on Thursday after being rejected at a key resistance level earlier in the week.
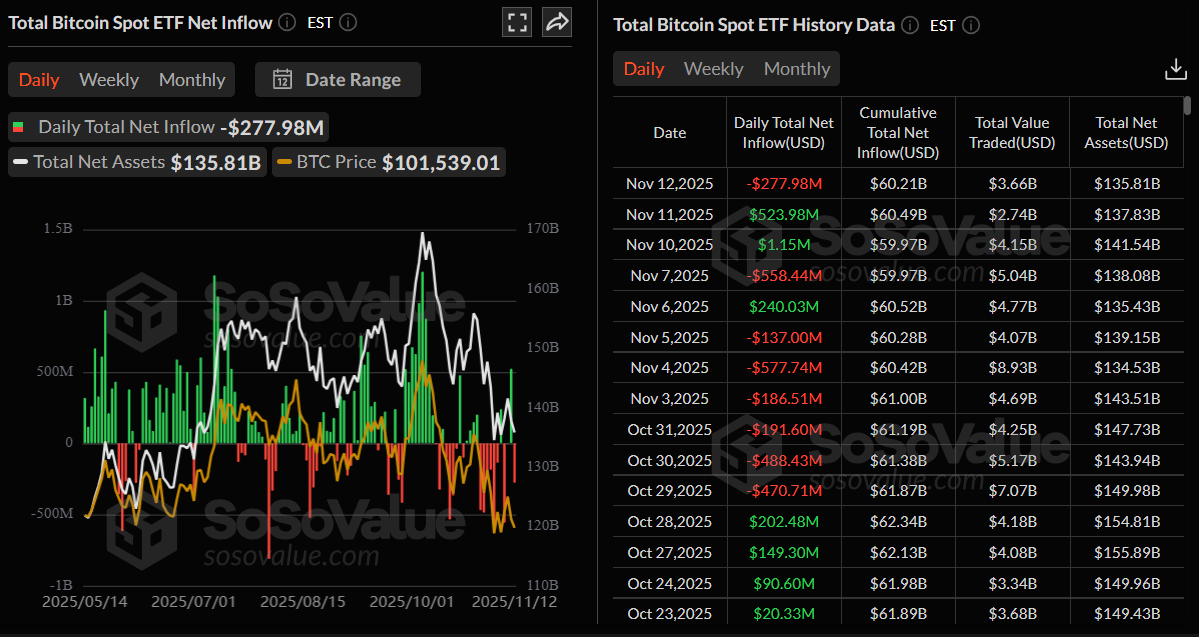
- US-listed spot Bitcoin ETFs continue to record mixed flows, reflecting uncertain institutional sentiment.
- On-chain and off-chain data suggest Bitcoin remains range-bound between $97,000 and $111,000, stabilizing but not yet ready for a bullish reversal.

Bitcoin (BTC) price is trading sideways around $102,800 at the time of writing on Thursday, reflecting persistent market indecision after encountering resistance earlier this week. The range-bound price action is further supported by mixed flows in spot Bitcoin Exchange Traded Funds (ETFs). At the same time, on-chain data indicate that BTC is stabilizing within a defined range between $97,000 and $111,000, with no clear macro catalyst, suggesting that a decisive breakout may still be some distance away.
Indecisiveness among institutional investors
Institutional flows reflect a mixed sentiment so far this week, as Bitcoin spot ETFs saw alternating inflows and outflows — outflows of $277.98 million on Wednesday contrast with the $523.98 million inflow on Tuesday and $1.15 million on Monday, according to SoSoValue data. This highlights indecision among institutional investors, as fluctuating ETF flows suggest a cautious approach toward the largest cryptocurrency by market capitalization.
On-chain data suggest BTC remains in a mild bearish phase
Glassnode's weekly report highlighted that Bitcoin remains in a mild bearish phase, trading between $97,000 and $111,000, with resistance near $116,000 marked by top-buyers’ supply cluster.
The report further explained that the seller exhaustion and renewed accumulation near $100,000 provide short-term support but lack strong follow-through demand.
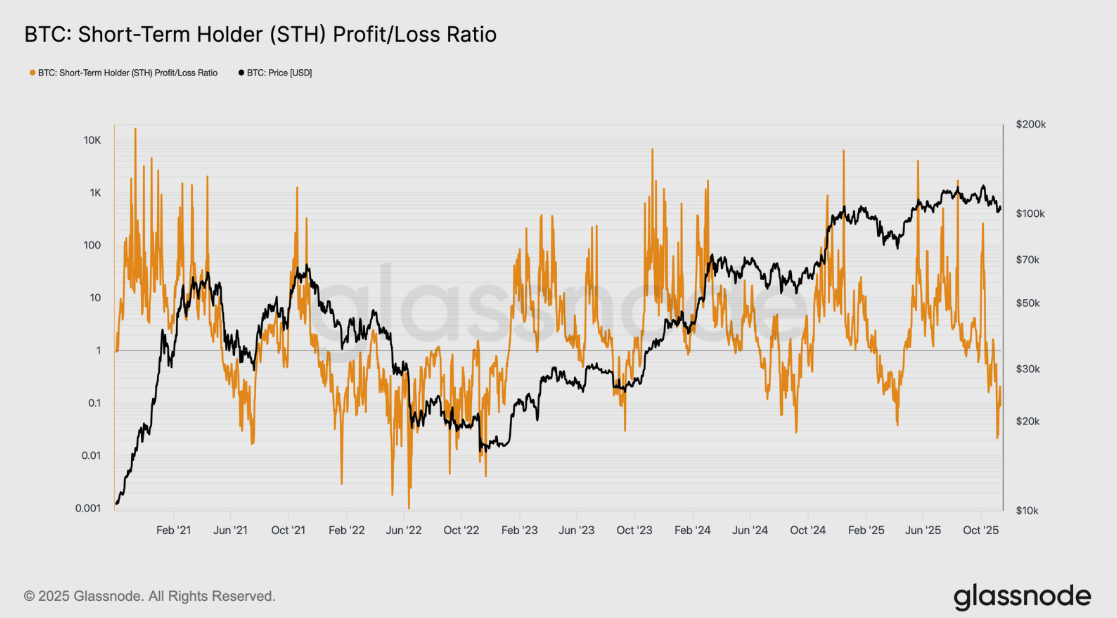
As shown in the chart below, Bitcoin tested $98,000, the STH Realized Profit-Loss Ratio fell below 0.21, suggesting over 80% of realized value came from coins sold at a loss. This intensity of capitulation briefly exceeded the last three major washouts of this cycle, underscoring how top-heavy the market has become and how pivotal the $100,000 level remains for near-term stability.
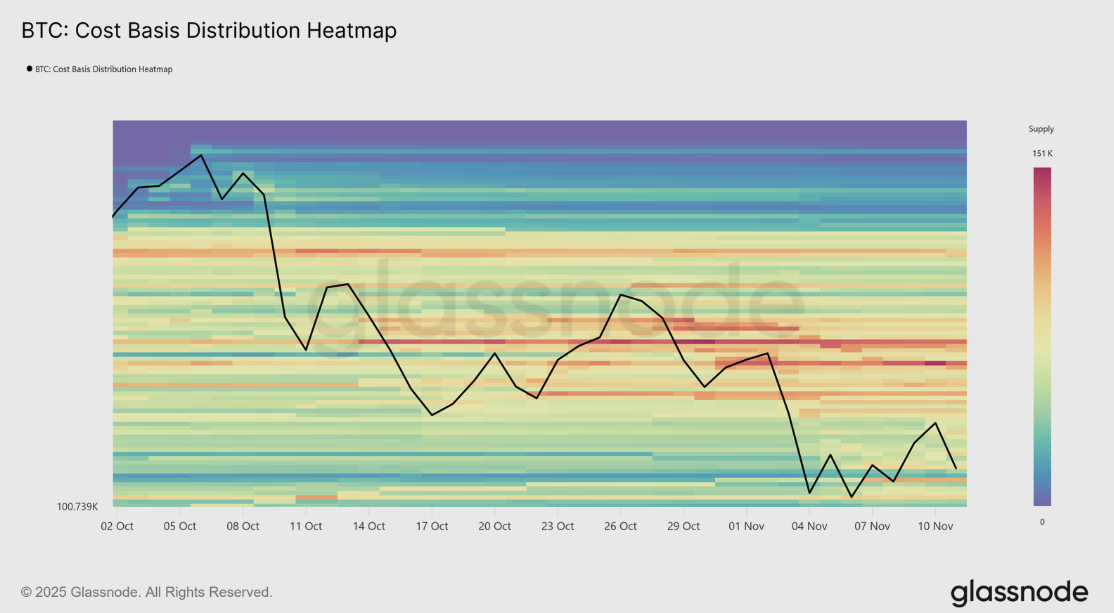
Moreover, the Cost Basis Distribution Heatmap also showed a dense supply cluster between $106,000 and $118,000 continues to cap upward momentum, as many investors use this range to exit near breakeven. This overhang of latent supply creates a natural resistance zone where rallies may stall, suggesting that sustained recovery will require renewed inflows strong enough to absorb this wave of distribution.
Off-chain indicators also echo a cautious tone, with ETF outflows, muted funding rates, and low open interest pointing to subdued speculative engagement. At the same time, options traders continue to favor downside protection around the $100,000 line.
The analyst concluded that “overall, both on-chain and off-chain signals portray a market in a state of consolidation, stabilizing yet not yet ready to confirm a bullish reversal. Until renewed inflows or a clear macro catalyst emerge, Bitcoin appears bound to oscillate within this $97,000–$111,000 corridor, with $100,000 remaining the psychological line of defence.”
Bitcoin Price Forecast: BTC trades within a range-bound scenario
Bitcoin price rose slightly and retested the key resistance at $106,453 —the 38.2% Fibonacci retracement (drawn from the April 7 low of $74,508 to the all-time high of $126,299 set on October 6, at $100,353) — on Monday and declined 4.11% the next two days. At the time of writing on Thursday, BTC recovers slightly, trading above $102,800.
If BTC continues its recovery and closes above the 38.2% Fibonacci retracement at $106,453 on a daily basis, it could extend the rally toward the 50-day Exponential Moving Average (EMA) at $109,369.
The Relative Strength Index (RSI) is 41, approaching the neutral 50 level and suggesting a fade in bearish momentum. For the recovery rally to be sustained, the RSI must move above the neutral level. Additionally, the Moving Average Convergence Divergence (MACD) lines are converging, with decreasing red histogram bars below the neutral level and suggesting an impending bullish crossover.
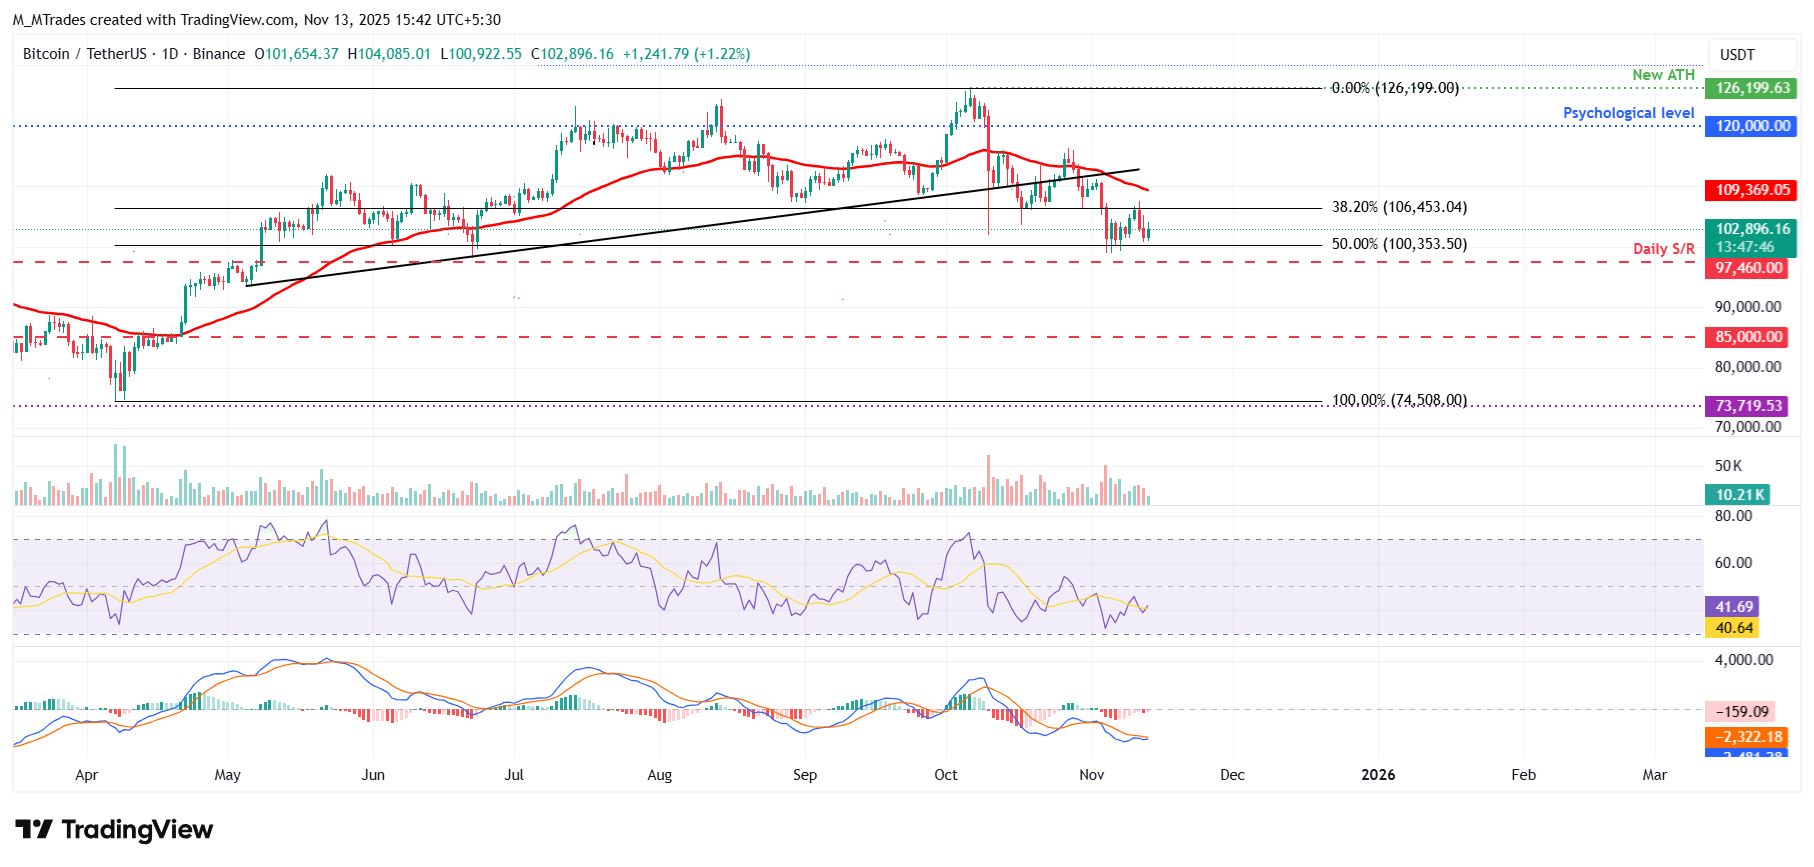
On the other hand, if BTC continues its correction, it could extend the decline toward the key support at $100,353.
Bitcoin, altcoins, stablecoins FAQs
Bitcoin is the largest cryptocurrency by market capitalization, a virtual currency designed to serve as money. This form of payment cannot be controlled by any one person, group, or entity, which eliminates the need for third-party participation during financial transactions.
Altcoins are any cryptocurrency apart from Bitcoin, but some also regard Ethereum as a non-altcoin because it is from these two cryptocurrencies that forking happens. If this is true, then Litecoin is the first altcoin, forked from the Bitcoin protocol and, therefore, an “improved” version of it.
Stablecoins are cryptocurrencies designed to have a stable price, with their value backed by a reserve of the asset it represents. To achieve this, the value of any one stablecoin is pegged to a commodity or financial instrument, such as the US Dollar (USD), with its supply regulated by an algorithm or demand. The main goal of stablecoins is to provide an on/off-ramp for investors willing to trade and invest in cryptocurrencies. Stablecoins also allow investors to store value since cryptocurrencies, in general, are subject to volatility.
Bitcoin dominance is the ratio of Bitcoin's market capitalization to the total market capitalization of all cryptocurrencies combined. It provides a clear picture of Bitcoin’s interest among investors. A high BTC dominance typically happens before and during a bull run, in which investors resort to investing in relatively stable and high market capitalization cryptocurrency like Bitcoin. A drop in BTC dominance usually means that investors are moving their capital and/or profits to altcoins in a quest for higher returns, which usually triggers an explosion of altcoin rallies.
Author

Manish Chhetri
FXStreet
Manish Chhetri is a crypto specialist with over four years of experience in the cryptocurrency industry.


