Cardano price could be on the verge of a breakout to $0.15, bullish metrics suggest
- Cardano price has formed an ascending triangle on the 12-hour chart.
- The digital asset is close to the upper trendline of the pattern and could see a breakout soon.

Cardano price has established a robust resistance barrier at $0.112, which is also the upper boundary of a 12-hour ascending triangle. A breakout above this point can easily drive ADA towards $0.13, but rejection would be a notable bearish sign.
Does Cardano price have enough strength to crack $0.112?
Cardano is currently trading at $0.105 and faces the 200-SMA at $0.108 as the closest resistance level on the 12-hour chart. A breakout from this point would push Cardano price towards the upper boundary of the triangle at $0.112.
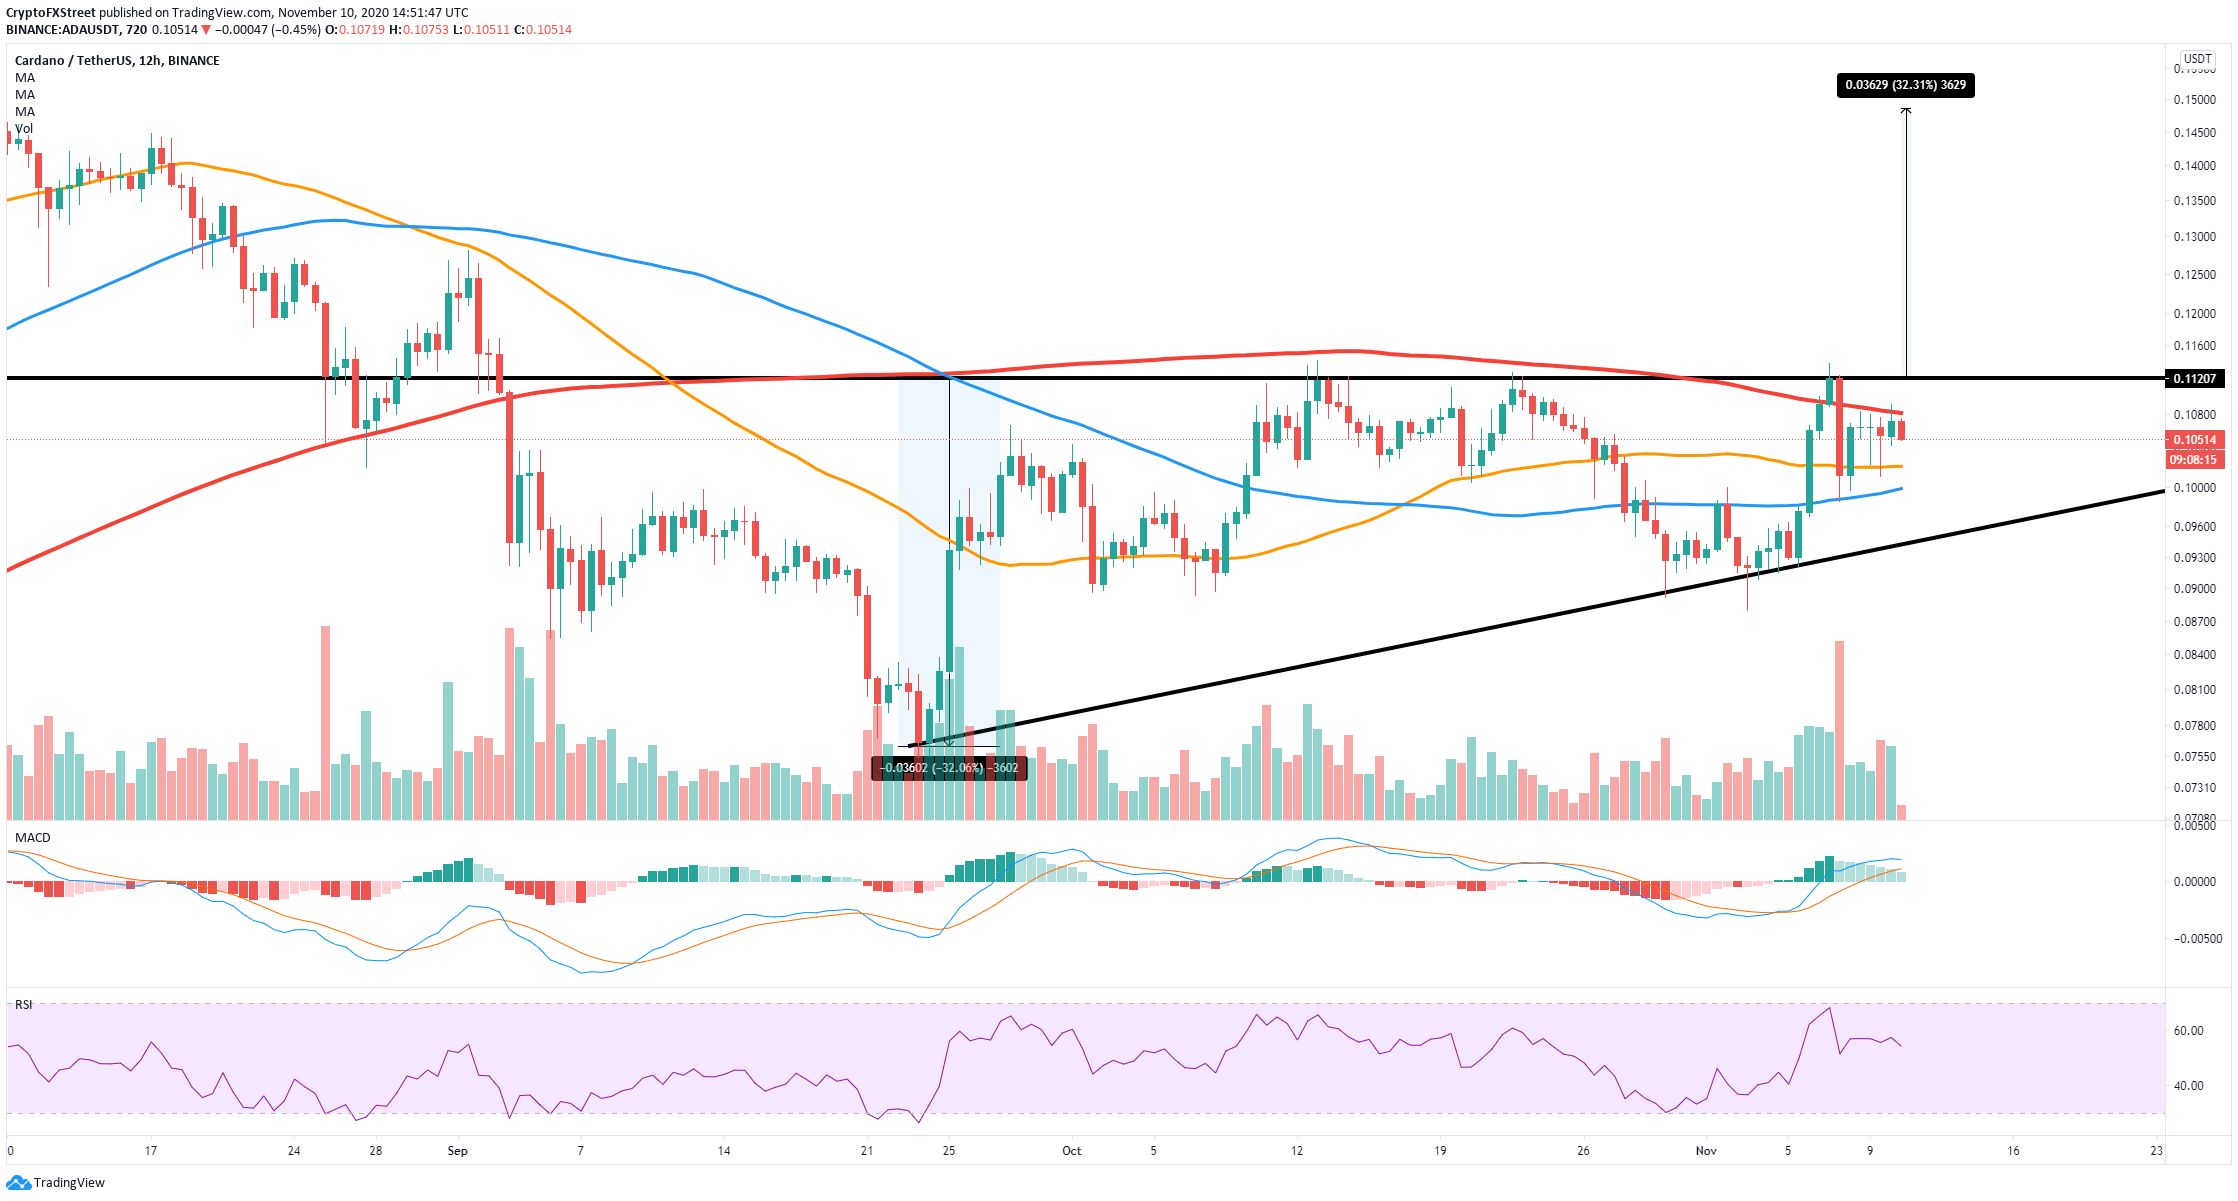
ADA/USD 12-hour chart
The MACD remains bullish, and the RSI is not overextended, which means Cardano price has a real chance of breaking $0.112, targeting $0.15 as an initial price point, using the height of the ascending triangle as reference.
-637406176263406799.png)
ADA new addresses chart
Furthermore, the number of new addresses joining the network of Cardano has increased significantly over the past week by 15%. This metric has established an uptrend since October 22, which seems to be gaining even more strength in the past seven days.
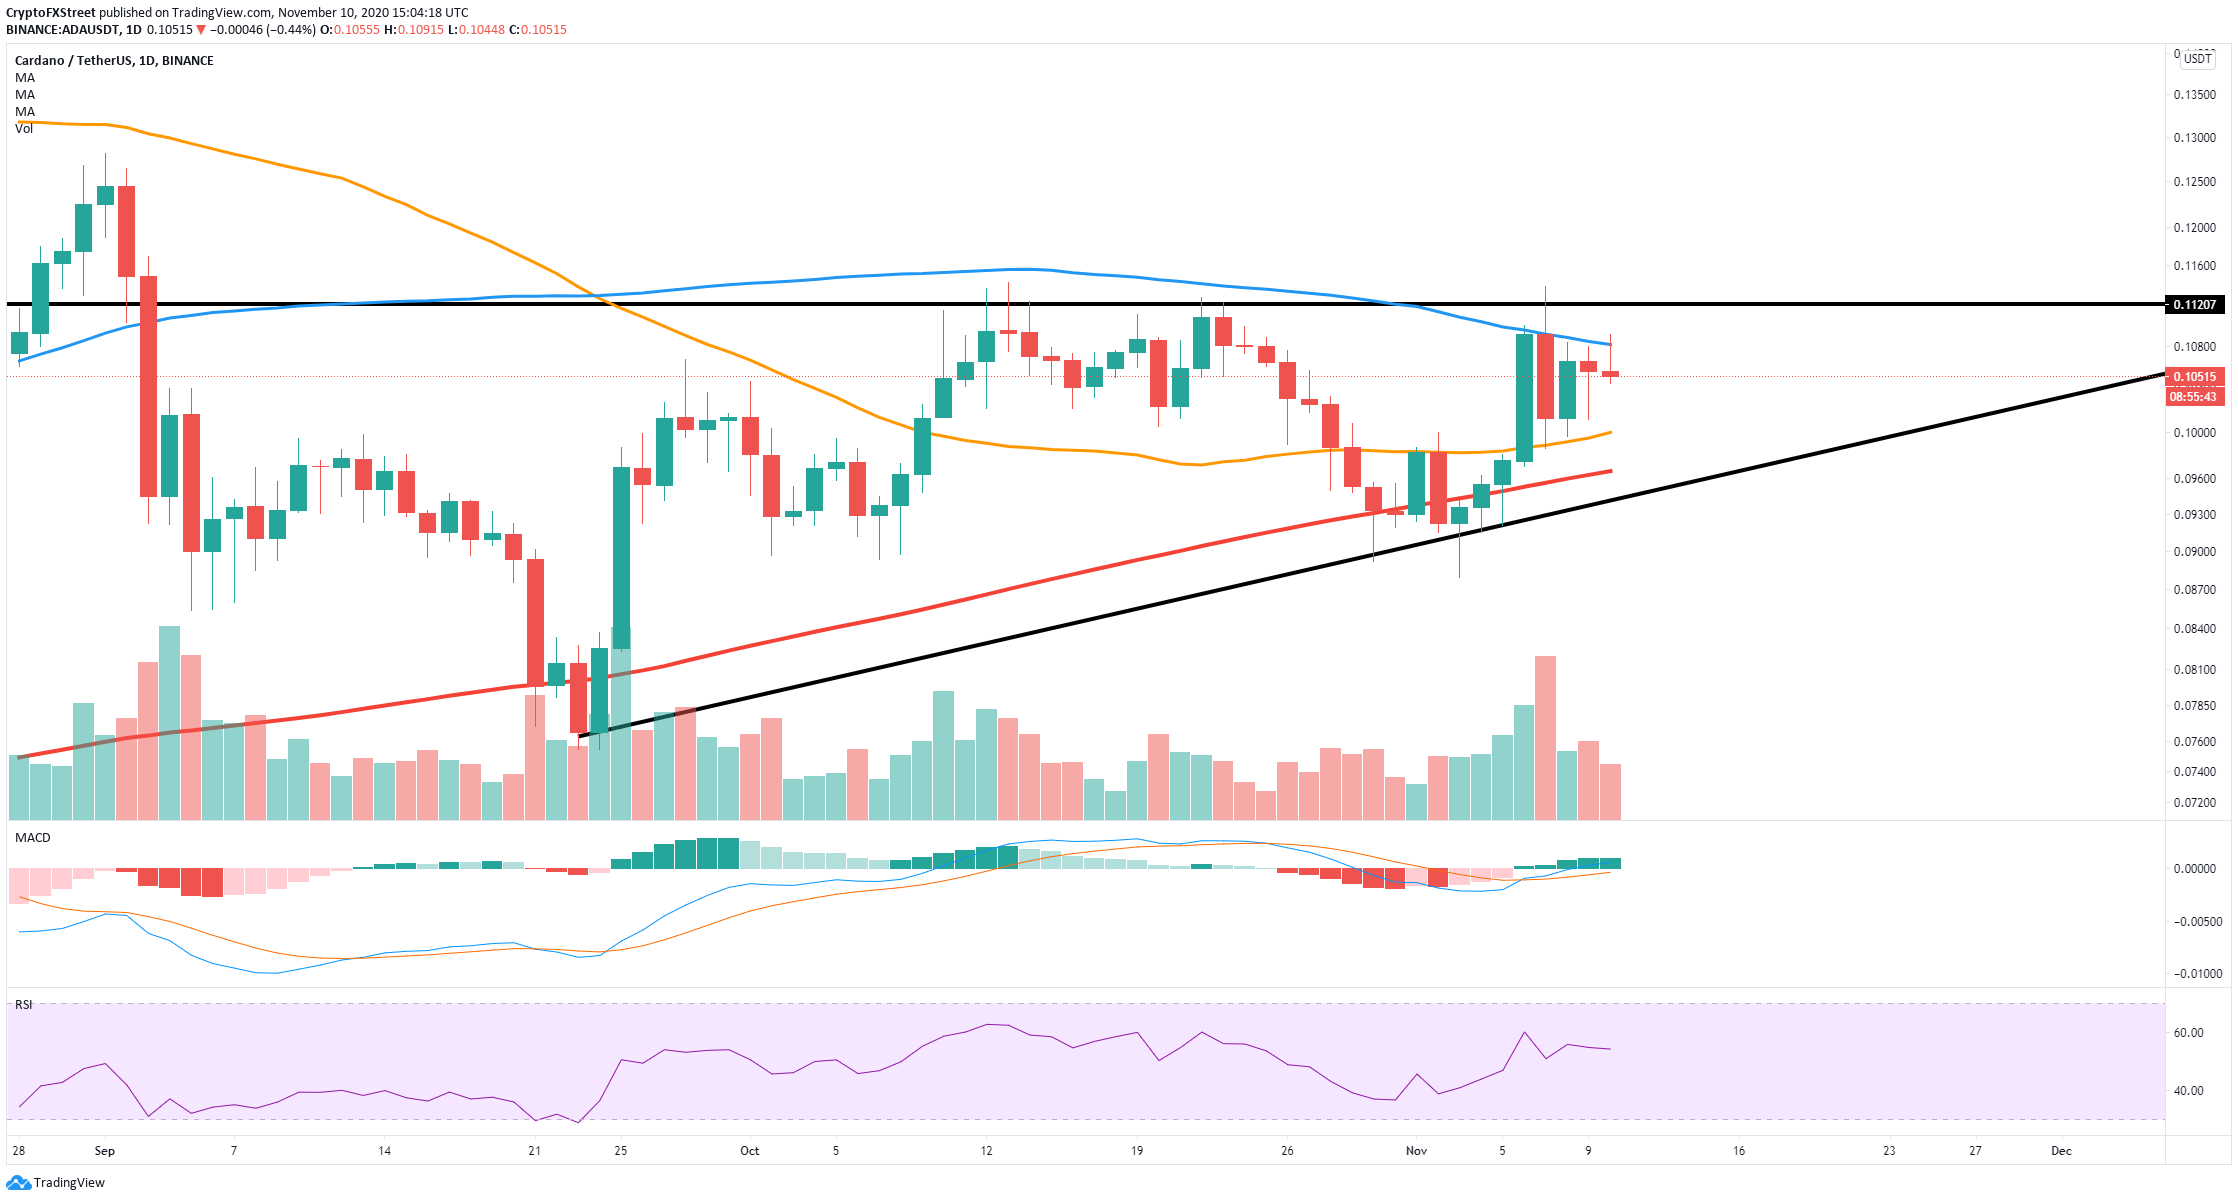
ADA/USD daily chart
Nonetheless, Cardano price has been rejected several times on the daily chart from the 100-SMA at $0.108. In the past 24 hours, the price touched $0.109 but got rejected again, which could poise downside risk for ADA. The nearest bearish price target would be the 50-SMA at $0.1, followed by the 200-SMA at $0.096 and, finally, the lower boundary of the ascending triangle at $0.095.
Author

Lorenzo Stroe
Independent Analyst
Lorenzo is an experienced Technical Analyst and Content Writer who has been working in the cryptocurrency industry since 2012. He also has a passion for trading.


