Cardano Price Analysis: ADA remarkable upswing hits pause as sell signals linger
- Cardano upside stalls short of $0.28 after an 82% upswing since January 1.
- A sell signal on the 4-hour hints at an imminent breakdown, perhaps to $0.20.

Cardano has been on a massive upswing since the beginning of the year. In less than seven days, the staking token has grown by more than 82% to exchange hands at the new yearly highs of around $0.2750. However, it seems that a reversal may come into the picture in the coming sessions, perhaps erase some of the gains made.
Cardano’s 24% upswing could be in jeopardy
ADA is doddering at $0.265 at the time of writing. Over the last 24 hours, the smart contract token has accrued more than 24% in gains and bagged nearly 44% in the past seven days. The sevenths largest cryptocurrency must close the day above $0.26 and preferably overcome the hurdle at $0.28 to sustain the uptrend towards $0.30.
On the downside, losses will come into the picture if Cardano makes a daily close under $0.26. Besides, the Relative Strength Index shows that ADA/USD is in oversold conditions. Therefore, buying volume is most likely to decrease as the seller grip strengthens. A rejection from the current price levels will seek support at $0.20, $0.18, and $0.14, in that order.
%20(25)-637455088758224965.png)
ADA/USD daily chart
The TD Sequential indicator has presented a sell signal on the 4-hour chart in the form of a green nine candlestick. The pessimistic outlook suggests a correction in one to four daily candlesticks. A red two candlestick trading below a preceding red one candle could serve as confirmation that Cardano is poised to drop further.
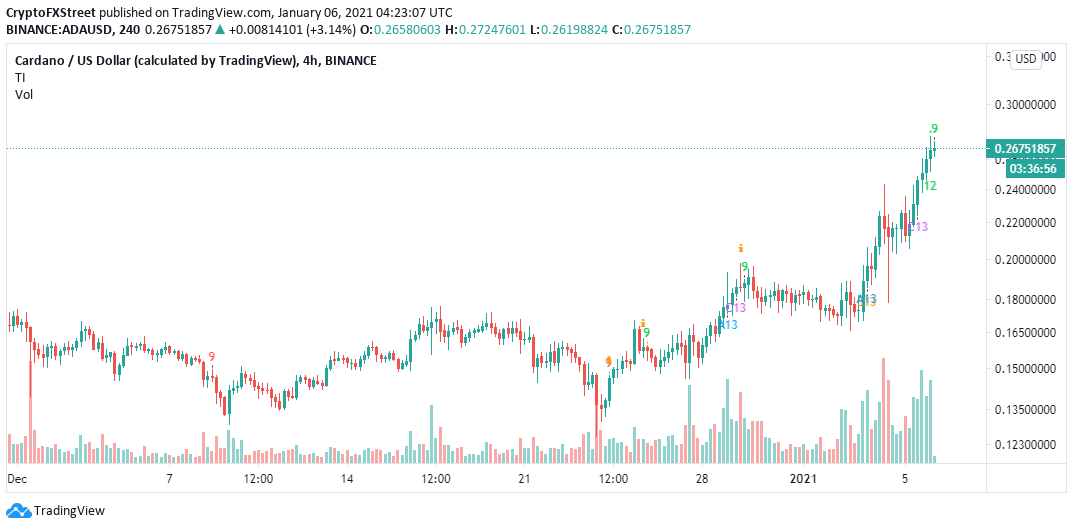
ADA/USD 4-hour chart
The bearish narrative is likely to be confirmed if Cardano fails to break through the immediate resistance running from $0.259 - $0.266, as shown by IntoTheBlock’s IOMAP model. Here, 502 addresses had previously bought roughly 17 million ADA.
-637455089119112931.png)
Cardano IOMAP chart
On the downside, the most robust support is highlighted between $0.228 and $0.0.236. Approximately 1,300 addresses had previously bought nearly 16 million ADA in the range. Upward correction is unlikely to continue. Hence the possibility of a correction or consolidation taking precedence in the near term.
On the other hand, a bullish picture will come into the picture if ADA/USD embraces support above $0.26. Moreover, trading past the stubborn resistance at $0.275 may open the road for gains towards $0.30 and perhaps restart the uptrend aiming for $0.4.
Author

John Isige
FXStreet
John Isige is a seasoned cryptocurrency journalist and markets analyst committed to delivering high-quality, actionable insights tailored to traders, investors, and crypto enthusiasts. He enjoys deep dives into emerging Web3 tren



