Cardano Elliott Wave: Calling the rally after flat pattern
In this technical article we’re going to take a look at the Elliott Wave charts charts of Cardano (ADAUSD) published in members area of the website. As our members know, we generally favor the long side in cryptos, and they have recently offered good trading opportunities. Caradano has recently complete expanded flat against the 0.514 low and made rally as expected.
Before we take a look at the real market example of Expanded Flat, let’s explain the pattern in a few words.
Elliott Wave expanded flat theory
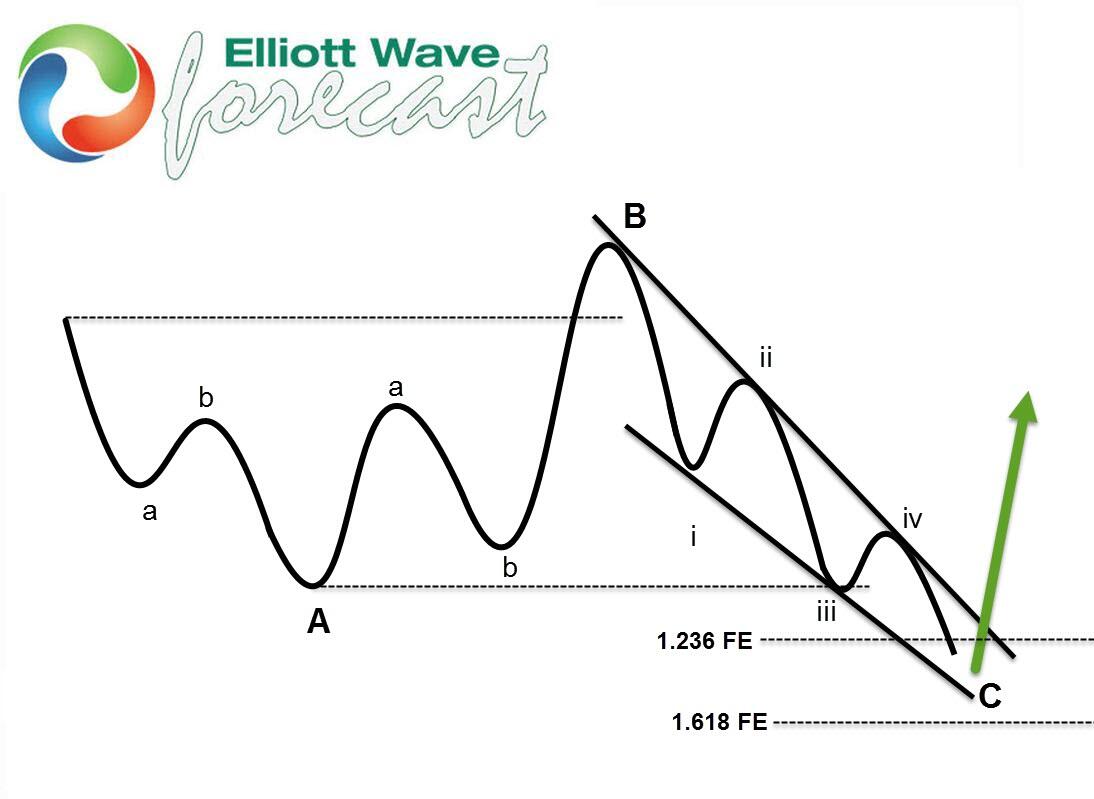
Elliott Wave Flat is a 3 wave corrective pattern which could often be seen in the market nowadays. Inner subdivision is labeled as A,B,C , with inner 3,3,5 structure. Waves A and B have forms of corrective structures like zigzag, flat, double three or triple three. Third wave C is always 5 waves structure, either motive impulse or ending diagonal pattern. It’s important to notice that in Irregular Flat Pattern wave B completes above the starting point of wave A. Wave C ends below the ending point of wave A . Wave C of Flat completes usually between 1.00 to 1.236 Fibonacci extension of A related to B, but sometimes it could go down to 1.618 fibs ext.
At the graphic below, we can see what Expanded Flat structure looks like
Now, let’s take a look what Elliott Wave Flat Pattern looks like in the real market
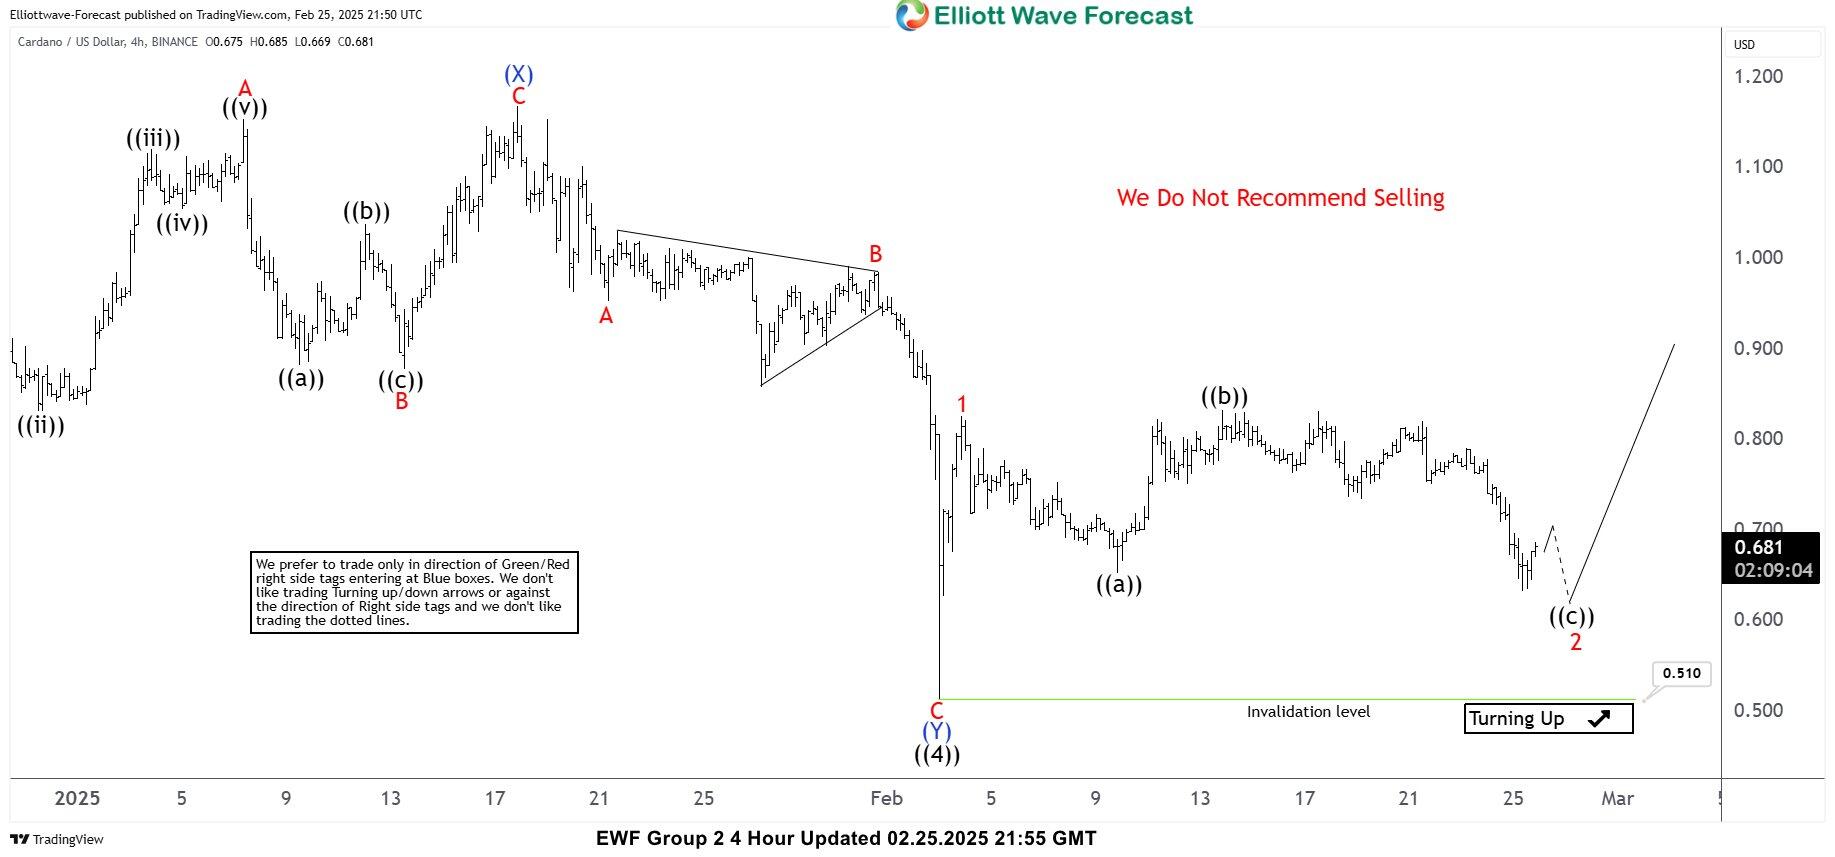
ADA/USD four-hour Elliott Wave analysis 02.25.2025
Currently, Cardano is correcting from the 0.510 low. Elliott Wave analysis suggests the pull back is unfolding as an Irregular Flat Pattern. On lower time frames, we can see that the inner subdivisions of waves ((a)) and ((b)) show corrective sequences. Wave ((b)) has broken above the starting point of wave ((a)), while wave ((c)) has broken below the ending point of wave ((a)), which is characteristic of an Irregular Flat. At this stage, wave ((c)) still needs another wave up to complete its 5-wave structure. We recommend members avoid selling at this stage. Once the flat structure completes, we expect a further rally in ADAUSD.
ADA/USD four-hour Elliott Wave analysis 03.05.2025
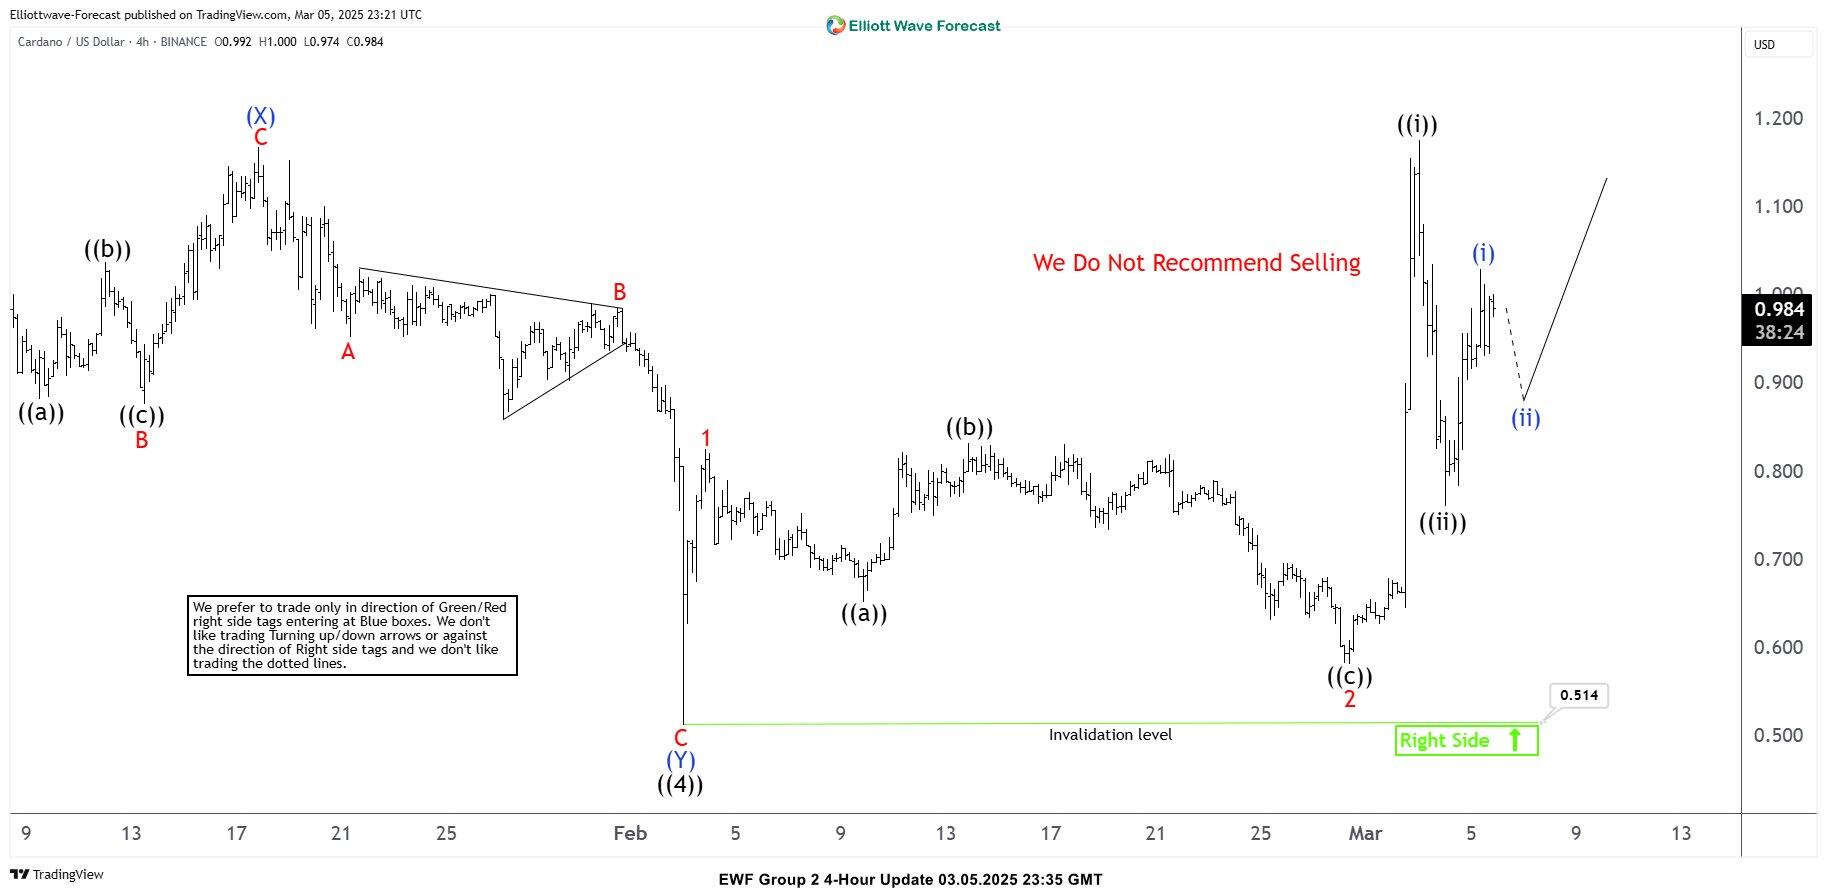
ADA/USD made another leg down as expected, completing the 2 red correction in a flat pattern. As anticipated, the crypto has started its rally. At this stage, we do not favor selling and expect more upside in the coming days.
Author

Elliott Wave Forecast Team
ElliottWave-Forecast.com


