Can this historical support trigger a 160% upswing in MATIC price
- MATIC price is hovering around a stable support level after a 65% crash.
- Investors can expect a bounce off the $1.01 support level to trigger a 160% rally to $2.89.
- A daily candlestick close below $0.745 will invalidate the bullish thesis for Polygon.

MATIC price prepares for a quick run-up as it arrives at a significant support level. A resurgence of bulls will add credence and a tailwind to this outlook and propel Polygon higher.
MATIC price is ready to rumble
MATIC price set an all-time high at $2.70 in May 2021 and crashed roughly 72% to set a significantly important swing low at $0.745. This move was followed by a quick 227% ascent in the next three days, resulting in a local top at $2.435.
Since then, MATIC price has been trading between the $0.745 and $2.435 range. As seen in the chart below, the price swept the low first and triggered a 370% upswing to set a new all-time high at $2.92 on December 27, 2021, coinciding with the -27% retracement level.
This move is often seen in ranging markets, where a sweep of one limit is followed by a rally to another. Since sweeping the range high at $2.43, MATIC price has dropped 65% to $1.08, where it currently trades.
Interestingly, Polygon bulls seem to have made a comeback here, forming a double bottom at the $1.01 support level. Therefore, market participants need to prepare for a rally that emerges from the current position.
The resulting leg up will likely propel MATIC price to the 50% retracement level at $1.59, constituting a 44% upswing from the current position. In a highly bullish case, Polygon could revisit the $2.89 hurdle again, bringing the total ascent to 163%.
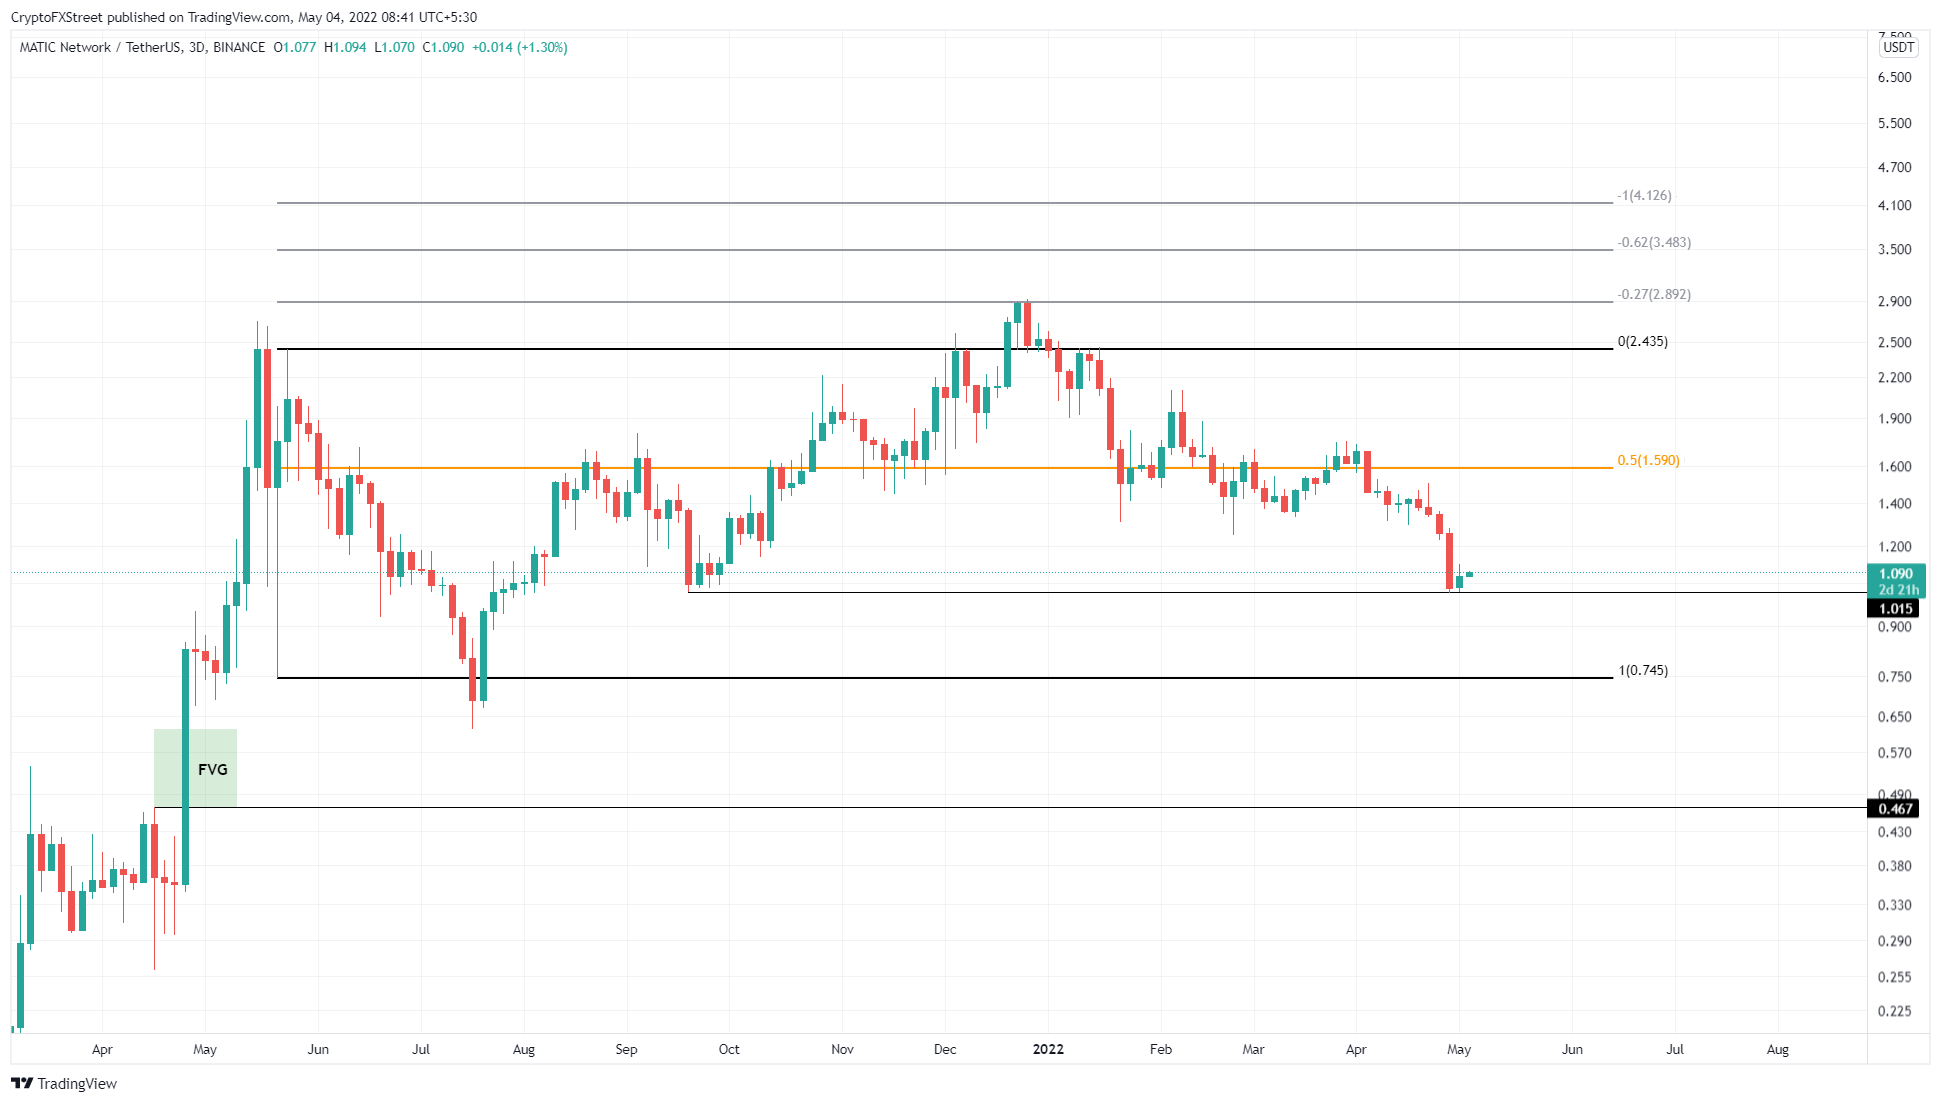
MATIC/USDT 3-day chart
Supporting this bullish outlook for Polygon is the 30-day Market Value to Realized Value (MVRV) model. This indicator is used to assess the average profit/loss of investors that purchased MATIC tokens over the past month.
Currently, the 30-day MVRV is hovering around -18%, indicating that the short-term holders are at a loss. Long-term holders often tend to accumulate in these conditions since the risk of a sell-off is very low.
Therefore, investors can expect MATIC price to form a base around the $1.01 support level and trigger an uptrend.
 [08.48.45, 04 May, 2022]-637872364857811126.png)
MATIC 30-day MVRV chart
While things are looking optimistic for the Layer 2 token, a daily candlestick close below $0.745 will invalidate the range and the bullish thesis for Polygon. In such a case, MATIC price might crash to $0.467 due to the price inefficiency, extending from $0.621 to $0.467.
Author

Akash Girimath
FXStreet
Akash Girimath is a Mechanical Engineer interested in the chaos of the financial markets. Trying to make sense of this convoluted yet fascinating space, he switched his engineering job to become a crypto reporter and analyst.


