BTC/USD: Uptrend continues to favour buyers

While bears did indeed make an appearance last week and snap an eight-week winning streak, BTC/USD remains on track to record a third consecutive month in the green (MTD performance: +11.6%). In a market demonstrating uptrends on both the weekly and daily timeframes, the recent surge witnessed the major cryptocurrency reach $45,000, levels not seen since April 2022.
Weekly resistance ahead
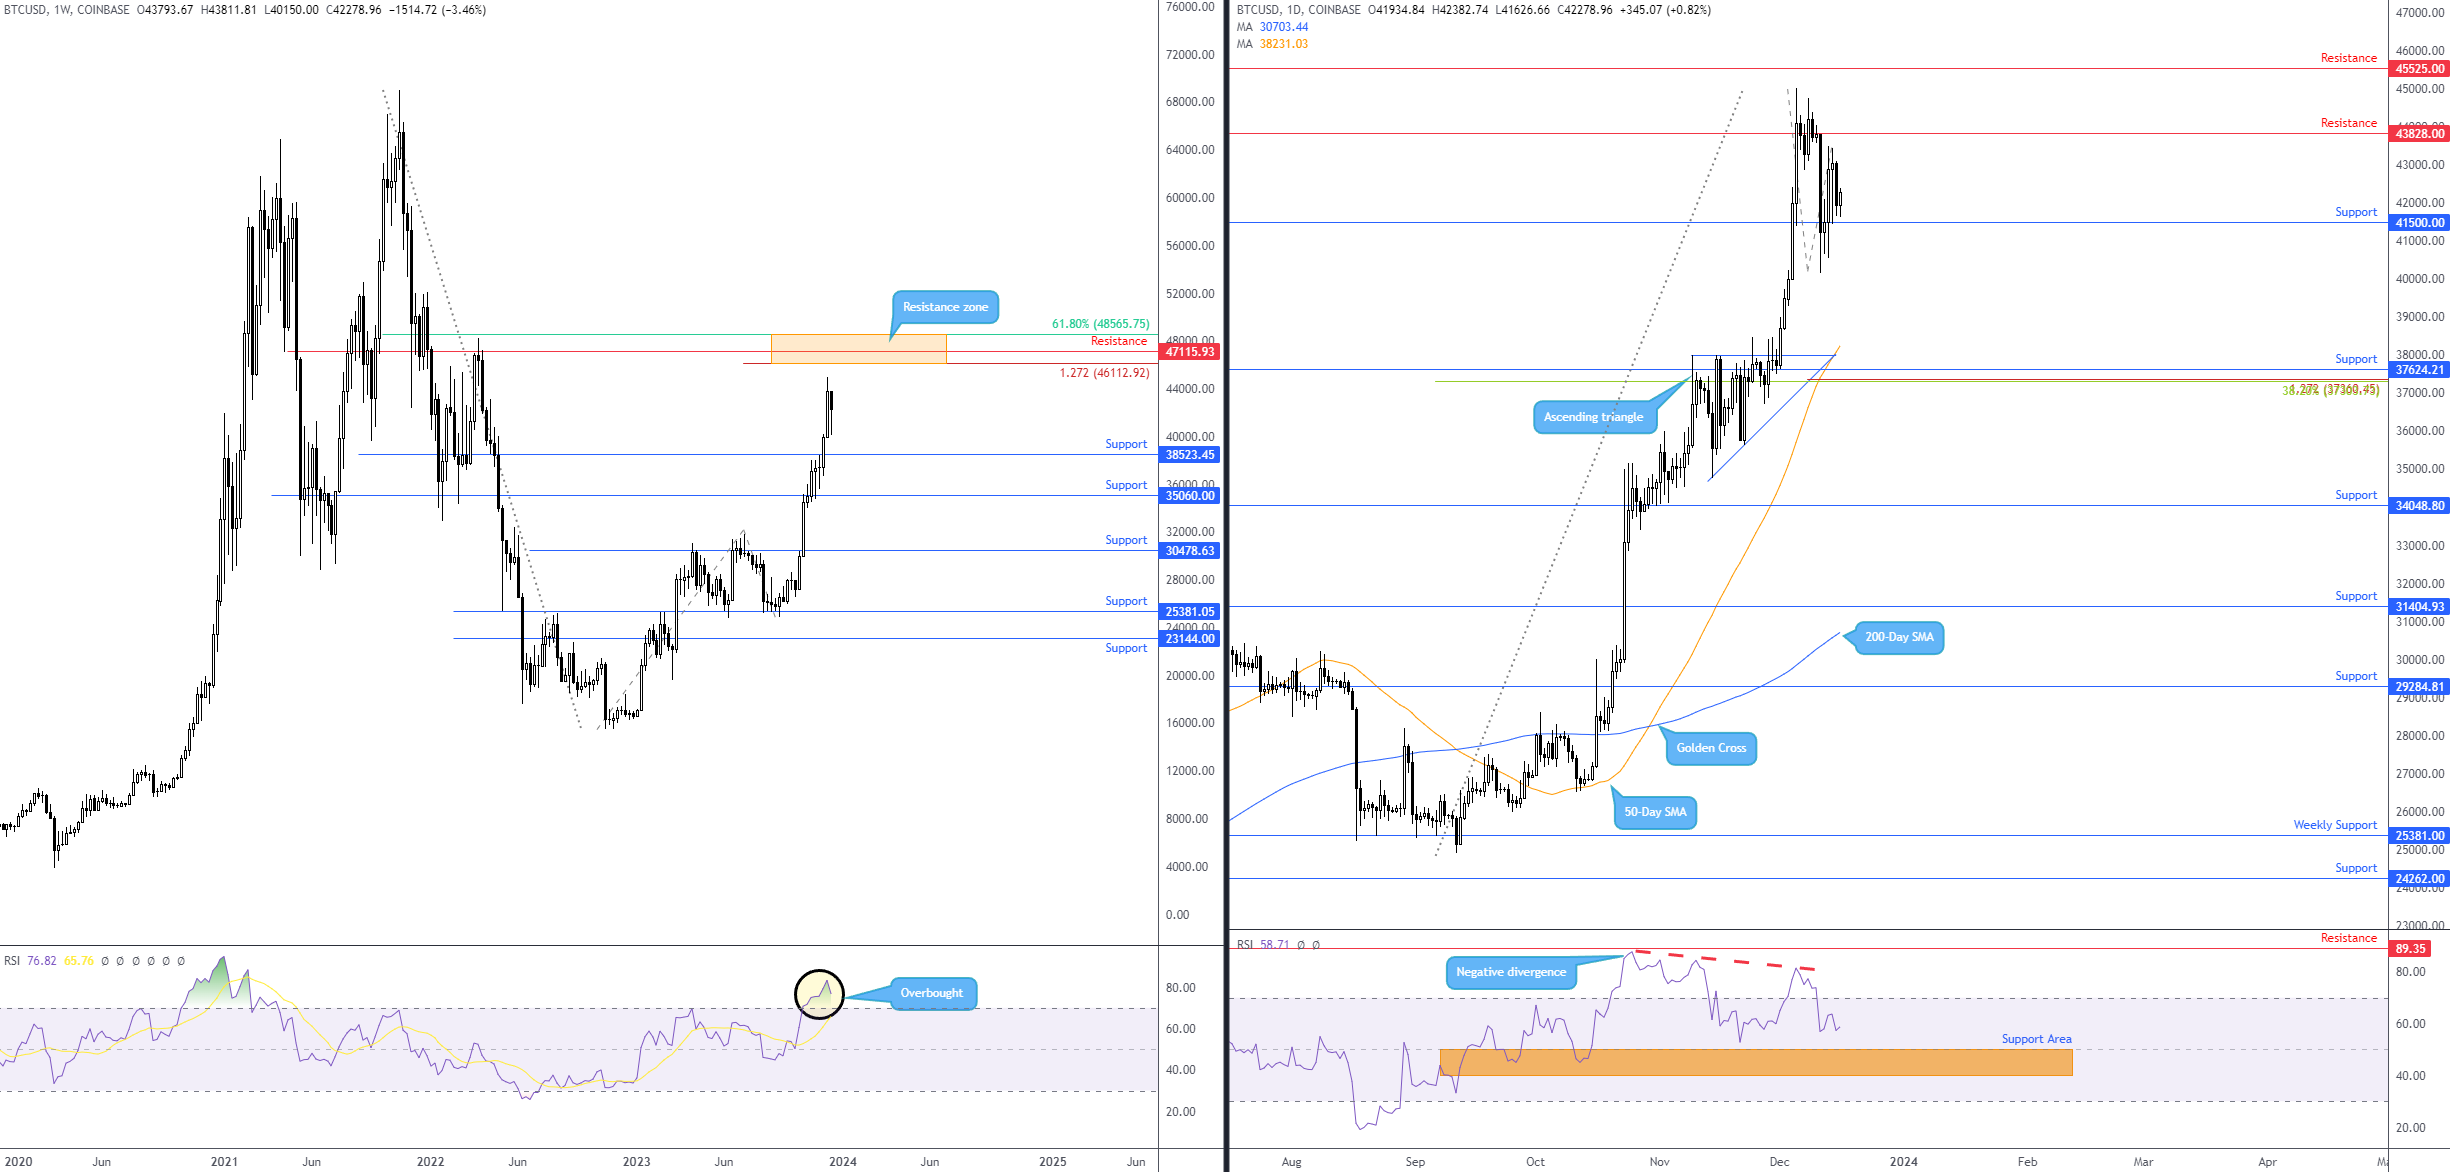
As aired in last week’s week ahead post, the biggest technical challenge for BTC/USD bulls remains the resistance zone between $48,565 and $46,112, comprises a horizontal base, a 1.272% Fibonacci projection ratio (an ‘alternate’ AB=CD bearish pattern) and a 61.8% Fibonacci retracement ratio. The Research Team also directed the technical spotlight to the Relative Strength Index (RSI), seen testing overbought levels (highest since early 2021) and suggesting that this market is perhaps overstretched and due a correction. Yet, it is worth bearing in mind that the RSI can remain overbought for prolonged periods in uptrends, and in this time, the indicator may whipsaw out of overbought territory (generally perceived as a bearish cue) a number of times before finally receding lower (put simply, several false signals can occur).
So, like last week, room for further technical buying is visible, as suggested by the space between the current price and weekly resistance, together with the uptrend, though fresh countertrend selling and profit-taking could equally be just around the corner.
Daily support to hold?
Chart studies from the daily timeframe offer support at $41,500, a level entering the fight following a feisty decline from resistance at $43,828. Now, resistance beyond current levels can be seen at $45,525, positioned just south of the weekly resistance area noted above. However, if price dips a toe in waters beneath $41,500 this week, a bearish setting to as far south as support from $37,624 may be seen. Importantly, this level of support is joined closely by a 1.272% Fibonacci projection ratio at $37,360 (a potential ‘alternate’ AB=CD harmonic bullish pattern) and a 38.2% Fibonacci retracement ratio around the same level. You might also acknowledge that the daily supports closely share chart space with weekly support highlighted above at $38,523. Hence, this may be recognised as representing a solid support area should price test the base this week.
This week?
While not out of the question, given the strength of buyers in recent weeks and the current uptrend, a correction as far south as daily support around $37,624 may be a challenge. Consequently, there’s an increased probability that buyers could defend current support on the daily timeframe at $41,500 and reach for the area between the lower boundary of weekly resistance at $46,112 and daily resistance at $45,525.
As for shorts, the Research team recently highlighted that from the aforementioned resistance between weekly and daily charts, you’d unlikely observe many commit initially from this zone. If the unit does rotate southbound from the resistance, it will likely be gradual rather than an abrupt push lower, which will provide traders/investors with the opportunity to assess price action and evaluate if there is bearish interest before committing.
Charts: TradingView
Author

Aaron Hill
FP Markets
After completing his Bachelor’s degree in English and Creative Writing in the UK, and subsequently spending a handful of years teaching English as a foreign language teacher around Asia, Aaron was introduced to financial trading,


