BTC/USD Crypto Signal

Yesterday’s signals were not triggered, as none of the key levels were ever reached.
Today’s BTC/USD Signals
Risk 0.75% per trade.
Trades must be taken from 8am London time to 5pm Tokyo time, during the next 24-hour period only.
Long Trades
-
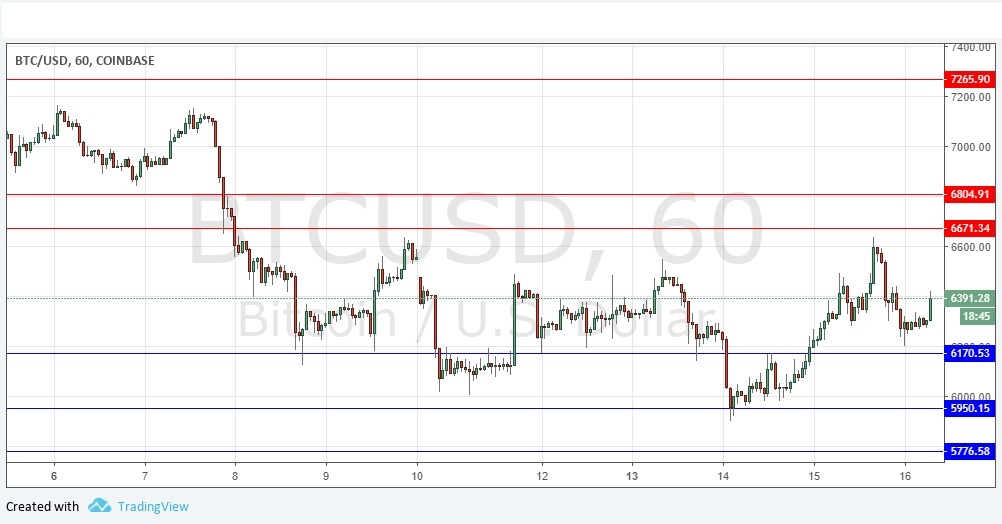
Long entry after a bullish price action reversal on the H1 time frame following the next touch $6,171 or $5,950.
-
Put the stop loss 1 pip below the local swing low.
-
Move the stop loss to break even once the trade is $200 in profit by price.
-
Remove 50% of the position as profit when the trade is $200 in profit by price and leave the remainder of the position to run.
Short Trades
-
Short entry after a bearish price action reversal on the H1 time frame following the next touch of $6,671 or $6,805.
-
Put the stop loss 1 pip above the local swing high.
-
Move the stop loss to break even once the trade is $200 in profit by price.
-
Remove 50% of the position as profit when the trade is $200 in profit by price and leave the remainder of the position to run.
The best method to identify a classic “price action reversal” is for an hourly candle to close, such as a pin bar, a doji, an outside or even just an engulfing candle with a higher close. You can exploit these levels or zones by watching the price action that occurs at the given levels.
BTC/USD Analysis
I wrote yesterday that I was unsure as to likely short-term direction here, as although we had some bullish momentum, this entire area between $6,500 and $6,805 looks likely to be difficult to break. This was a good call, as the price has spent more time rising than falling but was held by $6,600.
The long-term picture shows a bearish trend which is slowly weakening away to almost nothing. Over the medium-term, we see fluctuating bullishness with bearishness. These developments are making Bitcoin increasingly hard to trade profitably. I have no directional bias today, although it can be said that right now the bulls look like they have a slight edge over the bears.
There is nothing important due today concerning the USD.
Author

Adam Lemon
DailyForex.com
Adam is a Forex trader who has worked within financial markets for over 12 years, including 6 years with Merrill Lynch. He is certified in Fund Management and Investment Management by the U.K. Chartered Institute for Securities & Investment.


