BTC/USD Crypto Signal

Last Thursday’s signals were not triggered, as there was no bullish price action at $5,950.
Today’s BTC/USD Signals
Risk 0.75% per trade.
Trades may only be taken until 5pm Tokyo time, during the next 24-hour period.
Long Trades
-
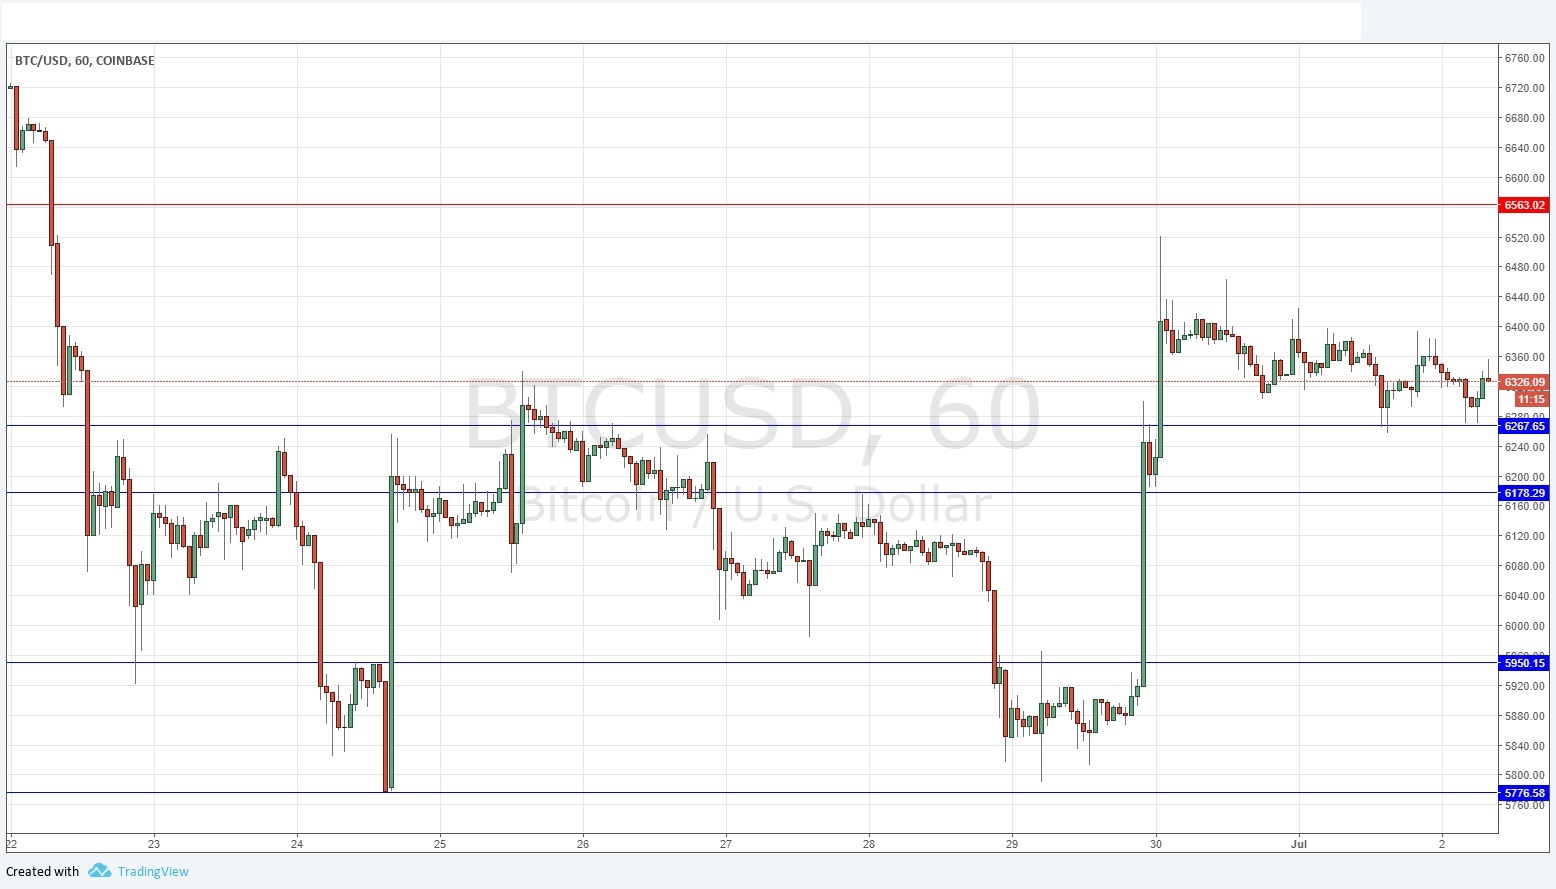
Long entry after a bullish price action reversal on the H1 time frame following the next touch of $6,268, $6,178, or $5,950.
-
Place the stop loss 1 pip below the local swing low.
-
Move the stop loss to break even once the trade is $200 in profit by price.
-
Remove 50% of the position as profit when the trade is $200 in profit by price and leave the remainder of the position to run.
Short Trades
-
Short entry after a bearish price action reversal on the H1 time frame following the next touch of $6,563.
-
Place the stop loss 1 pip above the local swing high.
-
Move the stop loss to break even once the trade is $200 in profit by price.
-
Remove 50% of the position as profit when the trade is $200 in profit by price and leave the remainder of the position to run.
The best method to identify a classic “price action reversal” is for an hourly candle to close, such as a pin bar, a doji, an outside or even just an engulfing candle with a higher close. You can exploit these levels or zones by watching the price action that occurs at the given levels.
BTC/USD Analysis
I wrote last Thursday that although there was a long-term bearish trend, I had no short-term directional bias. The picture here has changed over the past few days, with Bitcoin now looking considerably more bullish after breaking up strongly beyond $6,250 where it is now gently selling off into a bullish pennant formation. This has bullish implications, yet I am nervous of the repeated large upper wicks of the pennant, so I think that if the price gets established below $6,268 the bullish pennant should be discounted. If this price area holds, it does look likely that we will see another push up and maybe a test of the resistance at $6,563. I have a weakly bullish bias above $6,268.
Regarding the USD, there will be a release of ISM Manufacturing PMI data at 3pm London time.
Author

Adam Lemon
DailyForex.com
Adam is a Forex trader who has worked within financial markets for over 12 years, including 6 years with Merrill Lynch. He is certified in Fund Management and Investment Management by the U.K. Chartered Institute for Securities & Investment.


