Bitcoin’s wild price action causes $1 billion in liquidations as overhead pressure intensifies, eyes $30,000
- Bitcoin liquidations soar as the price plunges from levels above $40,000 to an intraday low of $33,344.
- Bitcoin may resume the uptrend if it closes the day above $35,000.
- Declines to $30,000 and $27,500 are not out of the picture as Bitcoin is yet to find a local low.

Bitcoin has been exceptionally volatile in the bull market. Hence, the massive liquidations over the weekend. The price plummeted from highs close to $42,000 and is yet to confirm formidable support. At the same time, the breakdown saw liquidations skyrocket on Bitfinex and other derivatives trading platforms.
Bitcoin liquidations surge as the price plunges toward $32,000
According to bybt, a cryptocurrency price tracking platform, over the last 24 hours, nearly 234,000 traders have been liquidated. Intriguingly, the largest liquidation order occurred on BitMEX-BTC with a value of $10 million. Binance leads in the number of Bitcoin longs liquidations at $632 million at the time of writing, followed by Huobi at $378 million.
-637459363848896080.png)
Bitcoin total liquidations by bybt
Bitcoin hunts for a short-term bottom
Bitcoin’s slump from levels above $40,000 caught many traders unawares. Massive Bitcoin long positions have been liquidated, with the price testing an intraday low of $33,344. At the time of writing, the flagship cryptocurrency has recovered to hold marginally above $35,000. However, it is not clear if a bottom is in already.
From a technical perspective, the 4-hour candlestick close will determine where Bitcoin goes from here. For instance, if support above the 50 Simple Moving Average is reclaimed, Bitcoin may swing past $38,000 in readiness for another leg up beyond $40,000.
On the other hand, holding above $35,000 will also sustain the price in the bulls’ hands and perhaps call for more buy orders as Bitcoin pushes past the coveted $40,000.
%20-%202021-01-11T070605.076-637459363914210486.png)
BTC/USD 4-hour chart
Some analysts believe that it is too early to tell if Bitcoin has reached a short term bottom to support a formidable recovery. Bitcoin holding above $35,000 would be a critical bullish signal. On the other hand, the daily supports are highlighted at $32,500, $30,000, and $27,500 in that order.
%20-%202021-01-11T071135.701-637459363962491392.png)
BTC/USD daily chart
A sell signal on the daily chart as presented by the TD Sequential indicator suggests that overhead pressure may continue to rise in the near-term. The call to sell manifested in the form of a green nine candlestick anticipating a one to four three-day candlesticks correction.
A red two candlestick trading below a preceding red one candle could serve as confirmation that Cardano is poised to drop further.
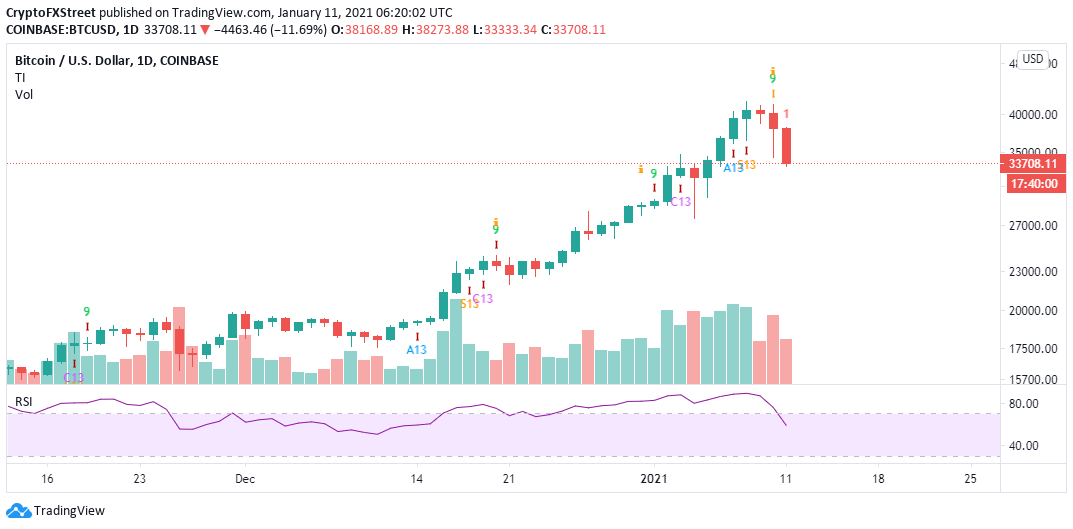
BTC/USD daily chart
It is worth mentioning that a dragonfly candle on the hourly chart was invalidated at $39,000. Bitcoin dived under $34,000 and almost tested $33,333. For now, holding above $36,000 and the 200 SMA on the 1-hour chart may save BTC from falling further and perhaps kick start the reversal to $40,000.
%20-%202021-01-11T072205.034-637459364020305051.png)
BTC/USD 4-hour chart
Bitcoin may not have bottomed on the downside, hence the possibility of retesting the support areas at $32,500, $30,000, and $27,500 in the short term. A daily close under the crucial $35,000 and the 200 SMA is likely to call for more sell orders, increasing the possibility of another breakdown.
Author

John Isige
FXStreet
John Isige is a seasoned cryptocurrency journalist and markets analyst committed to delivering high-quality, actionable insights tailored to traders, investors, and crypto enthusiasts. He enjoys deep dives into emerging Web3 tren



