|

Bitcoin Price Analysis: BTC fails to resist again above $41K, key levels to watch – Confluence Detector

  • BTC bulls are losing conviction after rejection again above $41K.
  • Bull-bear tug-of-war likely to extend amid healthy battle lines on either side. 
  • $38,800 is key support, $41,400 offers stiff resistance.

Bitcoin (BTC/USD) has turned south, having failed to find acceptance above the $41,000 level once again for the third straight session on Sunday.

Although the no.1 coin doesn’t seem to have topped out as yet, a corrective downside remains in place amid a bunch of healthy resistance levels stacked up.

Let’s see how the world’s most dominant crypto asset is positioned technically.

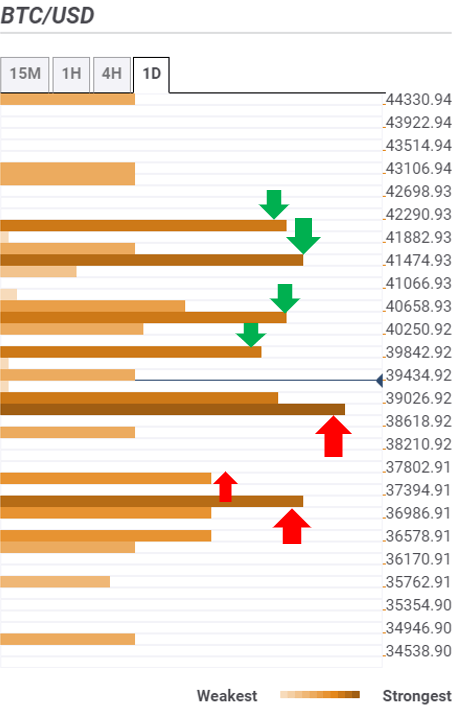
The Technical Confluences Indicator shows that the price has slipped back below the $40K barrier, with $38,800 seen as the powerful support. The level is the confluence of the previous day low and Fibonacci 23.6% one-week.

Acceptance below the latter could trigger a sharp drop towards $37,600, which is the pivot point one-day S2.

The next significant cushion for the BTC buyers awaits around $37K, where the pivot point one-month R2 lies.

Alternatively, recapturing the $40K level (Fibonacci 38.2% one-day) is critical to resuming the journey towards the record highs of $41,987.

Further up, $40,400 (Fibonacci 61.8% one-day/ SMA10four-hour) will challenge the bulls’ commitment, as they look to regain the $41K threshold.

Meanwhile, the intersection of the previous day high and Bollinger Band one-day Upper at $41,400 could offer stiff resistance.

Here is how it looks on the tool
fxsoriginal

About Confluence Detector

The TCI (Technical Confluences Indicator) is a tool to locate and point out those price levels where there is a congestion of indicators, moving averages, Fibonacci levels, Pivot Points, etc. Knowing where these congestion points are located is very useful for the trader, and can be used as a basis for different strategies.

Learn more about Technical   Confluence

Author

Dhwani Mehta

Dhwani Mehta

FXStreet

Residing in Mumbai (India), Dhwani is a Senior Analyst and Manager of the Asian session at FXStreet. She has over 10 years of experience in analyzing and covering the global financial markets, with specialization in Forex and commodities markets.


More from Dhwani Mehta
Share:

Editor's Picks

Cardano Price Forecast: ADA extends gains after Mastercard deal, Leios testing

Cardano price extends a steady near-term recovery on Monday, inching closer to the long-term 200-day EMA near $0.2464. The recent partnership with Mastercard and the Leios upgrade testing lift ADA investors' spirits. The technical outlook for ADA shows an upside bias as bullish momentum recovers.

Crypto Overview: Bitcoin reclaims $80,000 – Venice Token and NEAR Protocol rally

Bitcoin is trading above $81,000 holding firm after a 6% surge on Friday, linked to US financial watchdogs' efforts to structure crypto assets under existing rules following the CLARITY Act's failure to advance. Venice and NEAR Protocol have posted double-digit gains over the last 24 hours, scaling to fresh annual highs.

Top 3 Price Prediction: BTC extends gains, ETH and XRP advance in uptrend

Bitcoin, Ethereum, and Ripple extend their gains after posting strong gains of over 5%, 6% and 5%, respectively, last week. BTC trades above $81,300, ETH climbs above $2,600, and XRP holds above the key $1.300 support level. All three momentum indicators suggest early bullish momentum and hint at further gains ahead.

Bitcoin pushes above $81K, faces liquidation test between $83K and $86K
Bitcoin (BTC) rose above $81,000 on Friday after climbing back above the True Market Mean, signaling that the market could potentially have moved back into a bullish regime. The True Market Mean, at $76,660, represents the average price paid by active trading participants. BTC’s move back above the level often signals a return to bullish territory and can trigger positive short-term sentiment.
Bitcoin: BTC shrugs off CLARITY Act setback and hawkish Fed
Bitcoin (BTC) price action has remained resilient this week, trading above $78,000 at the time of writing on Friday, heading toward a key resistance zone. Institutional demand shows early signs of weakness, with spot Exchange Traded Funds (ETFs) on track for a second straight week of outflows, with over $420 million recorded through Thursday amid escalating Middle East tensions.


