Bitcoin’s September high and low are now critical

Since early September, we have been tracking Bitcoin’s (BTC/USD) price action as, preferably, what’s called in the Elliott Wave, an “Ending Diagonal.” In our previous update from two weeks ago, see here, we found
“Ending Diagonals are tricky because all their waves (i-ii-iii-iv-v) comprise three waves: 3-3-3-3-3 = abc-abc-abc-abc-abc. Thus, like the grey W-i and W-ii, we expect the grey W-iii to form three (orange) waves, as shown in Figure 1 below. Ideally, we see a bit more upside to around $65+/-1K, followed by a modest pullback (orange W-b) to around $61+/-1K before orange W-c to $73-79K kicks in. Contingent on holding above the warning levels...”
Figure 1. The daily resolution candlestick chart of BTC/USD with several technical indicators
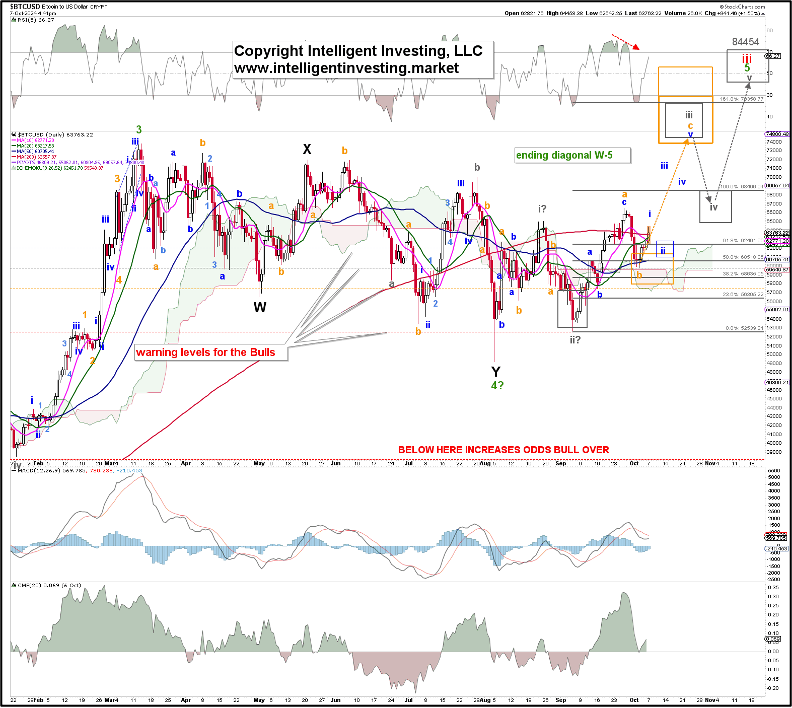
Fast-forward to September 27, when Bitcoin’s price reached $66547 and then declined to $59846 on October 3. Thus, our top and bottom forecasts were only off by 0.8 and 0.3%, respectively, something our premium members can rely on daily.
Thus, we continue to prefer the ED wave count until proven otherwise. This requires Bitcoin’s price to stay above the September 6 low on any pullback and then rally back above the September 27 high. Namely, if the orange W-c of the grey W-iii is underway, it will most likely subdivide into five smaller waves: blue W-i, ii, iii, iv, and v). In that case, W-i is underway, and W-ii to around $62+/-1K should materialize soon. From there, the blue W-iii, iv, and v can complete the orange W-c to ideally $74-76K.
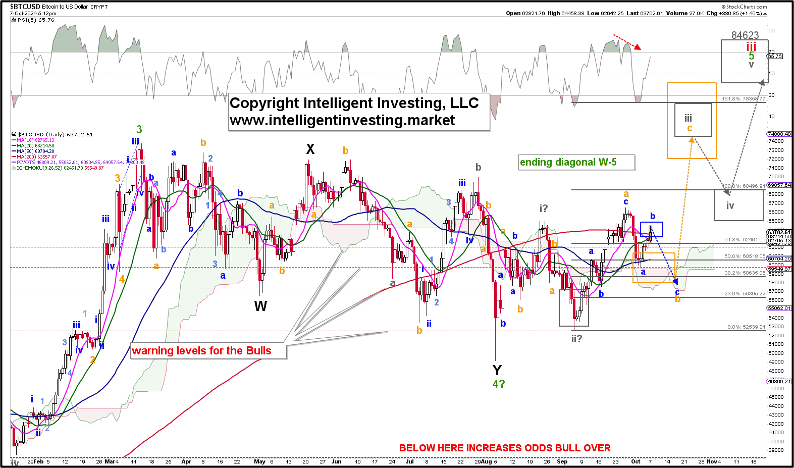
However, the orange W-b may not be complete, and a break below the October 4 low can usher in the option shown in Figure 2 below. It suggests that we see another small (blue) W-c lower, equal length the blue W-a, targeting the lower end of the ideal (orange) W-b zone at $58K From there the orange W-c setup can then be tried again.
Figure 2. The daily resolution candlestick chart of BTC/USD with several technical indicators
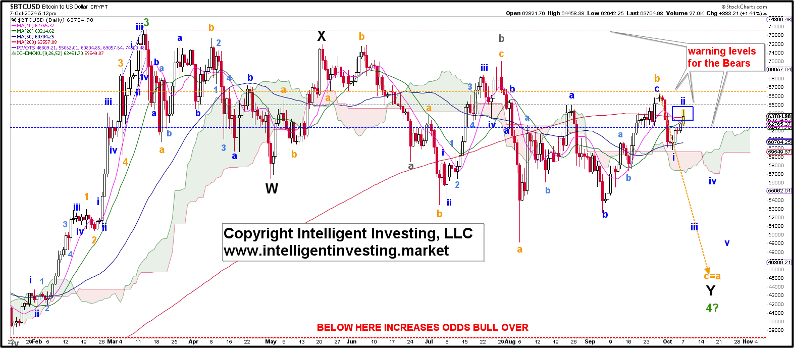
However, if the Bulls lose control of BTC’s price, we could still see the mid-$40Ks per the most bearish, but in our opinion the least likely, option in Figure 3 below. It will require a break below the September 6 low, with a severe warning for the Bulls below $57.5K (the orange horizontal line in Figures 1 and 2).
Figure 3. The daily resolution candlestick chart of BTC/USD with several technical indicators
How do you use this work to your advantage? Well, simple. We have been able to forecast the price action over the last month reliably and accurately using the ED’s path. Therefore, it remains our preferred POV, contingent on the price holding above the September 6 low, with a severe warning just below the October 3 low. For example, these price levels can be used as stop (loss) levels. We always trade the direction of the preferred view, while the alternative EW counts are only used as our “insurance policy” if we speculate wrongly. Ultimately, we are all speculators—people who guess about something uncertain.
Author

Dr. Arnout Ter Schure
Intelligent Investing, LLC
After having worked for over ten years within the field of energy and the environment, Dr.


