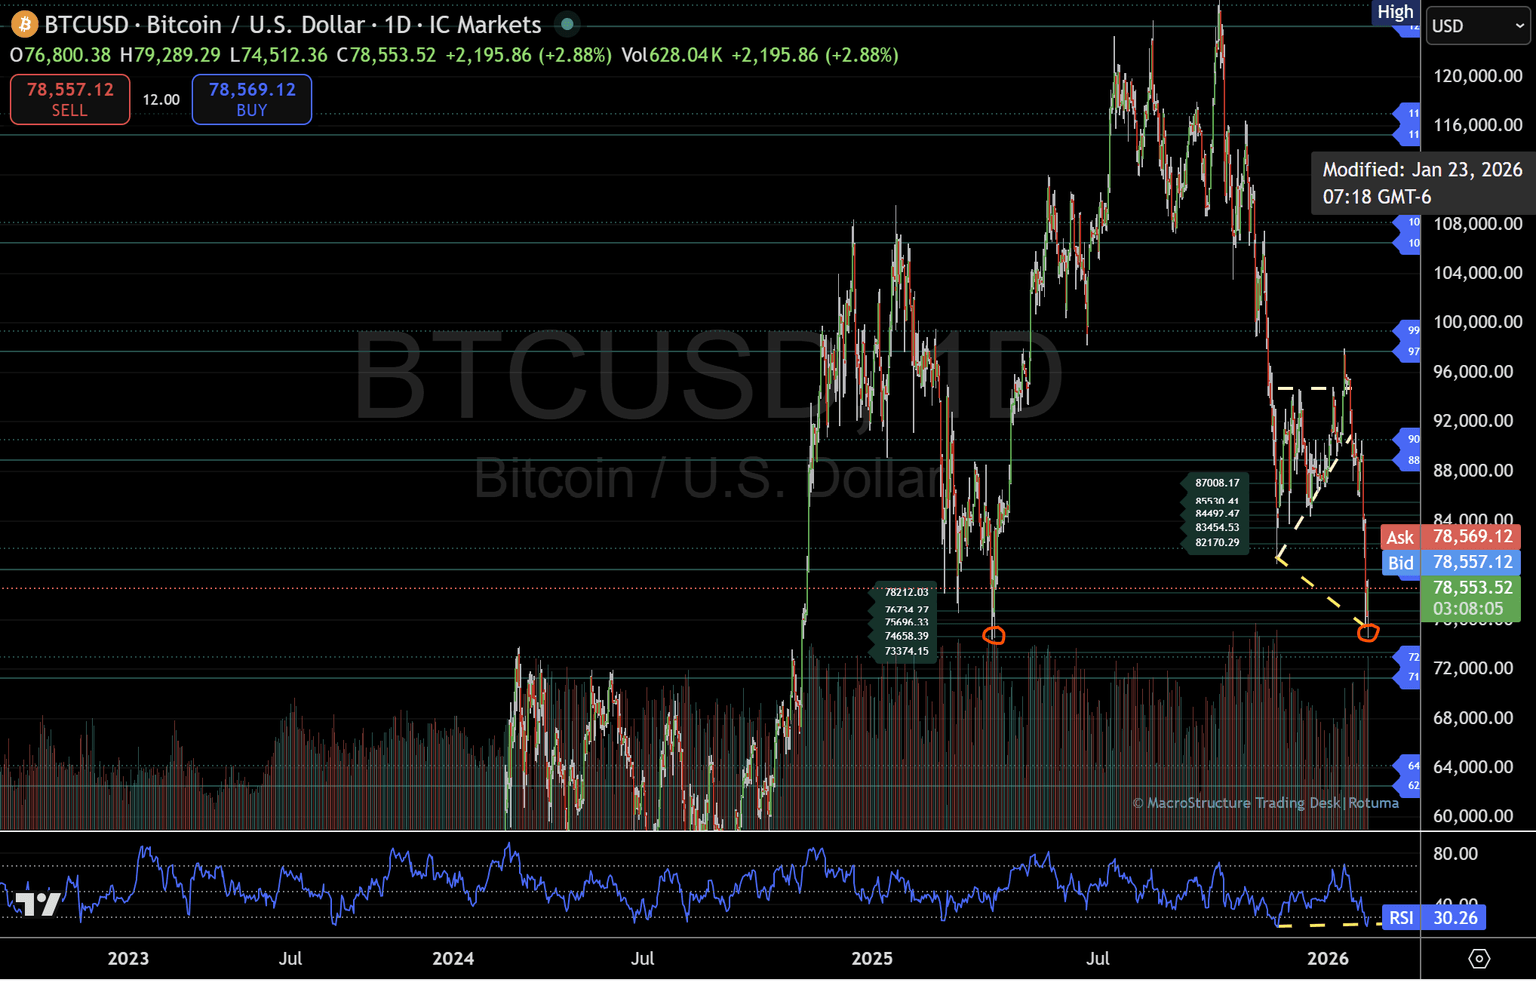
Bitcoin trades into lower structure as buyers attempt to rebuild balance

Bitcoin tests lower structural support after failing to reclaim 80,000, with price behaviour hinting at early attempts to form a new two-way range.
Bitcoin Price Analysis
This update is a follow-up to the January 30, 2026, desk report and continues to document how Bitcoin is trading within a well-defined structural framework that has remained intact since November 2025.
Rather than reacting to short-term volatility, this desk log focuses on how price behaves around predefined structural zones, and whether those areas are accepted or rejected over time.
Break below 80,000 shifts, focus to lower structure
In the previous update, Bitcoin was trading around a critical structural support near 80,000, a level that had repeatedly acted as a balance within the broader two-way structure.
Since then, price failed to reclaim that zone and rotated lower, briefly slipping beneath 80,000 before finding responsive buying interest deeper in the structure.
At the time of writing, Bitcoin has bounced from the lower structure near the mid-74,000 area, corresponding with Micro 2 support. This region aligns closely with the April 2025 lows, a reference point that previously marked the beginning of a powerful structural advance toward the 124,000 high.
The reaction here matters—not as a directional call, but as an observation of whether price can stabilise and begin rebuilding balance after the breakdown.
Can Bitcoin rebuild a two-way structure?
From a structural perspective, the key question is whether Bitcoin can regain and hold above 80,000.
- Acceptance above 80,000 would allow price to begin forming a new two-way structure, with 80,000 transitioning into a central pivot rather than resistance.
- Failure to reclaim and hold that level keeps the focus on the lower structure, where the 78,000 to 73,000 zone remains active.
These lower references are not forecasts—they are areas where structure already exists, and where price historically required time and participation before resolving higher.
Momentum divergence adds context, not direction
One additional development worth noting is the divergence between price and RSI, visible as Bitcoin tested lower structural levels.
While divergence alone does not define outcomes, it often appears during transition phases, where liquidation slows, and participation begins to shift. Whether this develops into sustained balance or resolves lower will depend entirely on price acceptance, not indicators.
January 28 context: Structure was already mapped
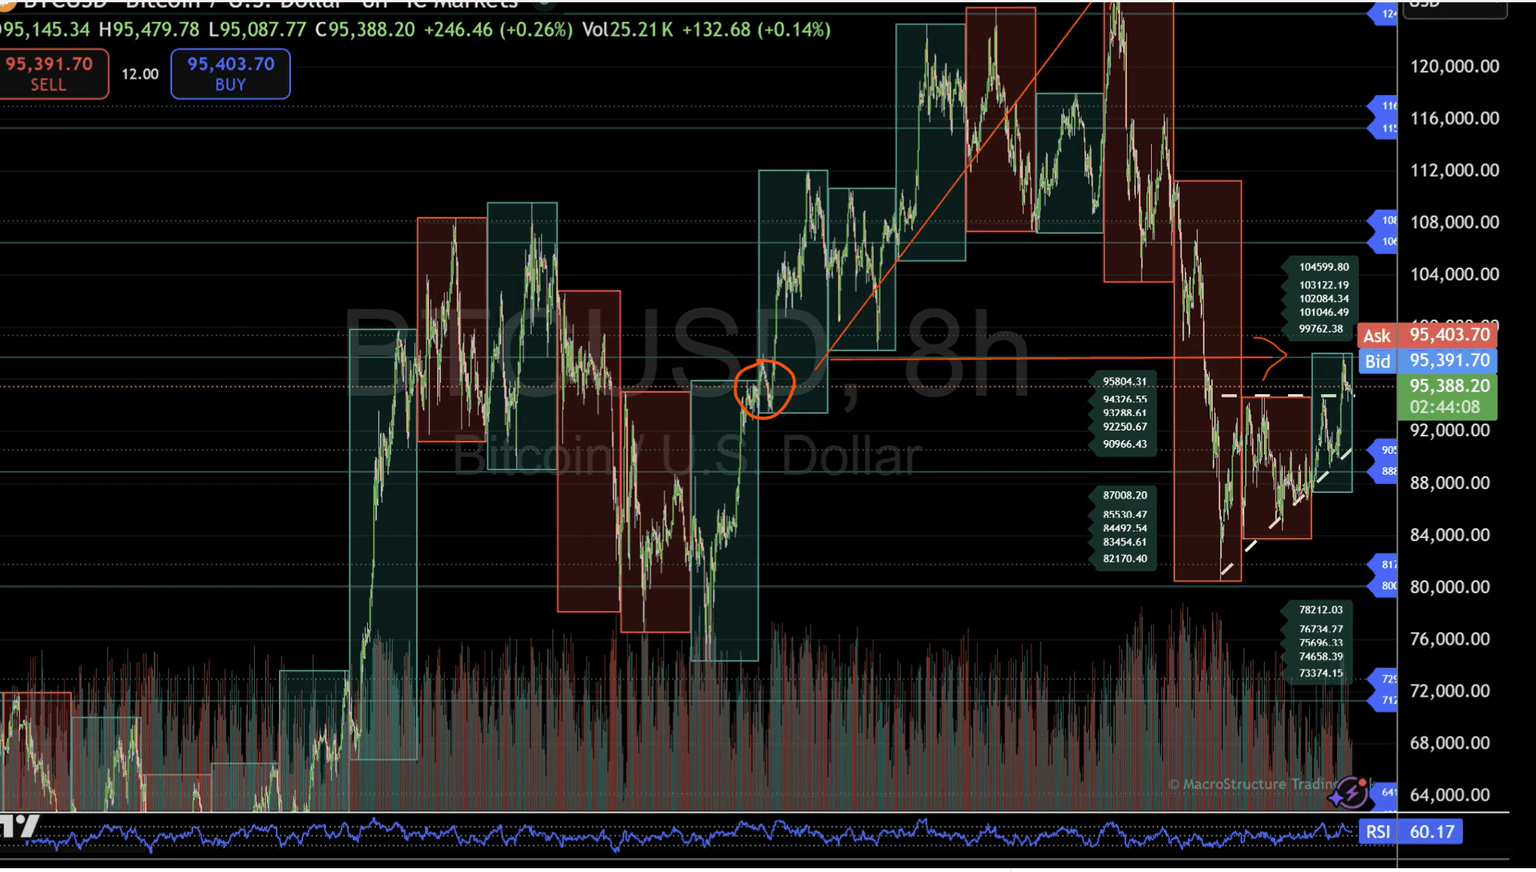
Importantly, the current area of trade was already identified in the January 28, 2026, video update, when Bitcoin completed its rotation into the prior two-way structure and began showing signs of exhaustion near the upper range.
This reinforces a core principle of the MacroStructure framework:
Structure exists before price arrives. What follows is the market’s response.
What to watch next
- Above 80,000: potential rebuilding of balance and two-way trade
- Below 78,000: continuation within the lower structure toward the next established floor
- Across all scenarios: observe acceptance, not reaction
Structure defines context; price reveals response.
These desk updates document a structure-first process, observing how price accepts or rejects predefined levels over time. Coverage spans futures, commodities, forex, bonds, crypto, stocks, and indices, with structure providing context before direction.
This observation is for informational purposes only and does not constitute financial advice.
Author

Denis Joeli Fatiaki
Independent Analyst
Denis Joeli Fatiaki possesses over a decade of extensive experience as a multi-asset trader and Market Strategist.


