Bitcoin Price Forecast: BTC recovers slightly amid ETF inflows, Strategy accumulation
- Bitcoin price steadies at $78,000 on Tuesday after rising 2.30% the previous day, following last week’s massive correction.
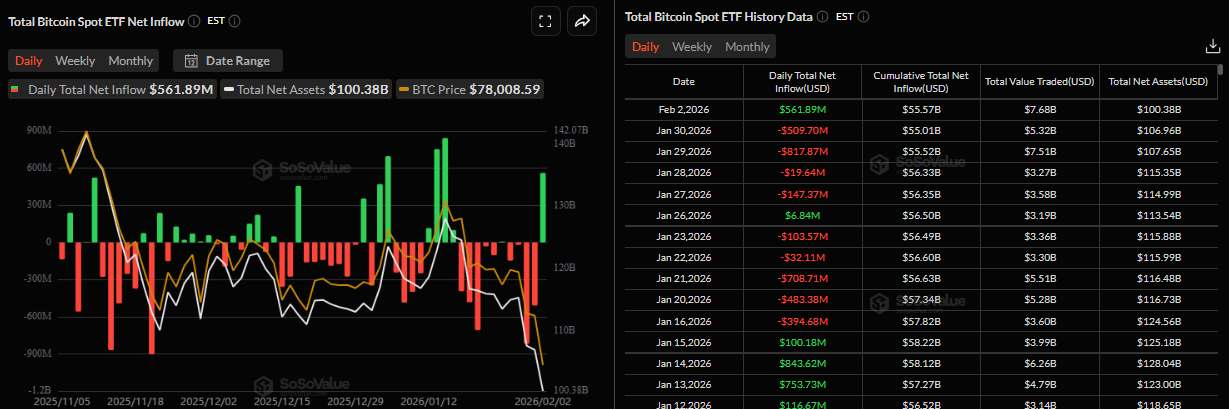
- US-listed spot ETFs record an inflow of $561.89 million on Monday, while Strategy adds 855 BTC to its reserve.
- Technical analysis suggests a short-term relief rally toward $82,600, though the move could be temporary before the downtrend resumes.

Bitcoin (BTC) price stabilizes at $78,000 at the time of writing on Tuesday after recovering 2.30% the previous day, following last week’s massive correction. The institutional demand provided short-term support to Crypto King as spot Exchange-Traded Funds (ETFs) recorded fresh inflows alongside Strategy (MSTR) accumulation on Monday. Traders should be cautious, as despite a short-term recovery, BTC's long-term trend remains bearish.
Institutions and corporates buy recent BTC dips
Institutional demand supported a slight recovery in Bitcoin at the start of the week. SoSoValue data shows that spot Bitcoin ETFs record a fresh inflow of $561.89 million on Monday, breaking the streak of outflows since last week. Moreover, Monday’s flow was the highest single-day inflow since mid-January. For the relief rally to be sustained, the ETF inflows must continue and intensify.
On the corporate front, Strategy (MSTR) announced on Monday that it purchased 855 BTC, bringing its total holdings to 713,502 BTC. Strategy’s average Bitcoin buying price stands at $76,052, and with BTC dipping below this level on Monday, MSTR slipped into unrealized losses for the first time since October 2023.
Easing US–Iran geopolitical tensions support a mild improvement in risk appetite
Iran has tentatively agreed to resume nuclear talks with the US as it tries to avert the threat of further military strikes, reports CNN.
The report further noted that Iran’s top diplomat, Abbas Araghchi, is expected to meet US special representative Steve Witkoff and US President Trump's son-in-law Jared Kushner in Istanbul on Friday.
These easing geopolitical tensions between the US and Iran boosted investors’ confidence slightly, further improving their appetite for riskier assets such as Bitcoin.
Some signs of concern
Galaxy Trading and Galaxy Asset Management reported on Tuesday that Bitcoin closed four consecutive red monthly candles for the first time since 2018, underscoring sustained downside momentum.
“46% of Bitcoin supply is now underwater (i.e., the coins previously moved onchain when prices were higher),” says Alex Thorn, Managing Director and Head of Firmwide Research at Galaxy Digital.
Thorn further noted, "At the moment, we still see little evidence of significant accumulation from whales or long-term holders, although long-term holder profit taking has begun to notably abate. Catalysts remain hard to find and narratives are also working against Bitcoin as it fails to trade along with gold and silver as part of a market-wide 'debasement hedge trade.' While passage of crypto market structure legislation (the “CLARITY Act”) could act as a near-term exogenous catalyst, odds of passage have diminished in recent weeks, and we see any positive momentum generated by passage more likely to yield benefit to altcoins than BTC."
Bitcoin Price Forecast: Is BTC’s recovery a dead-cat bounce pattern?
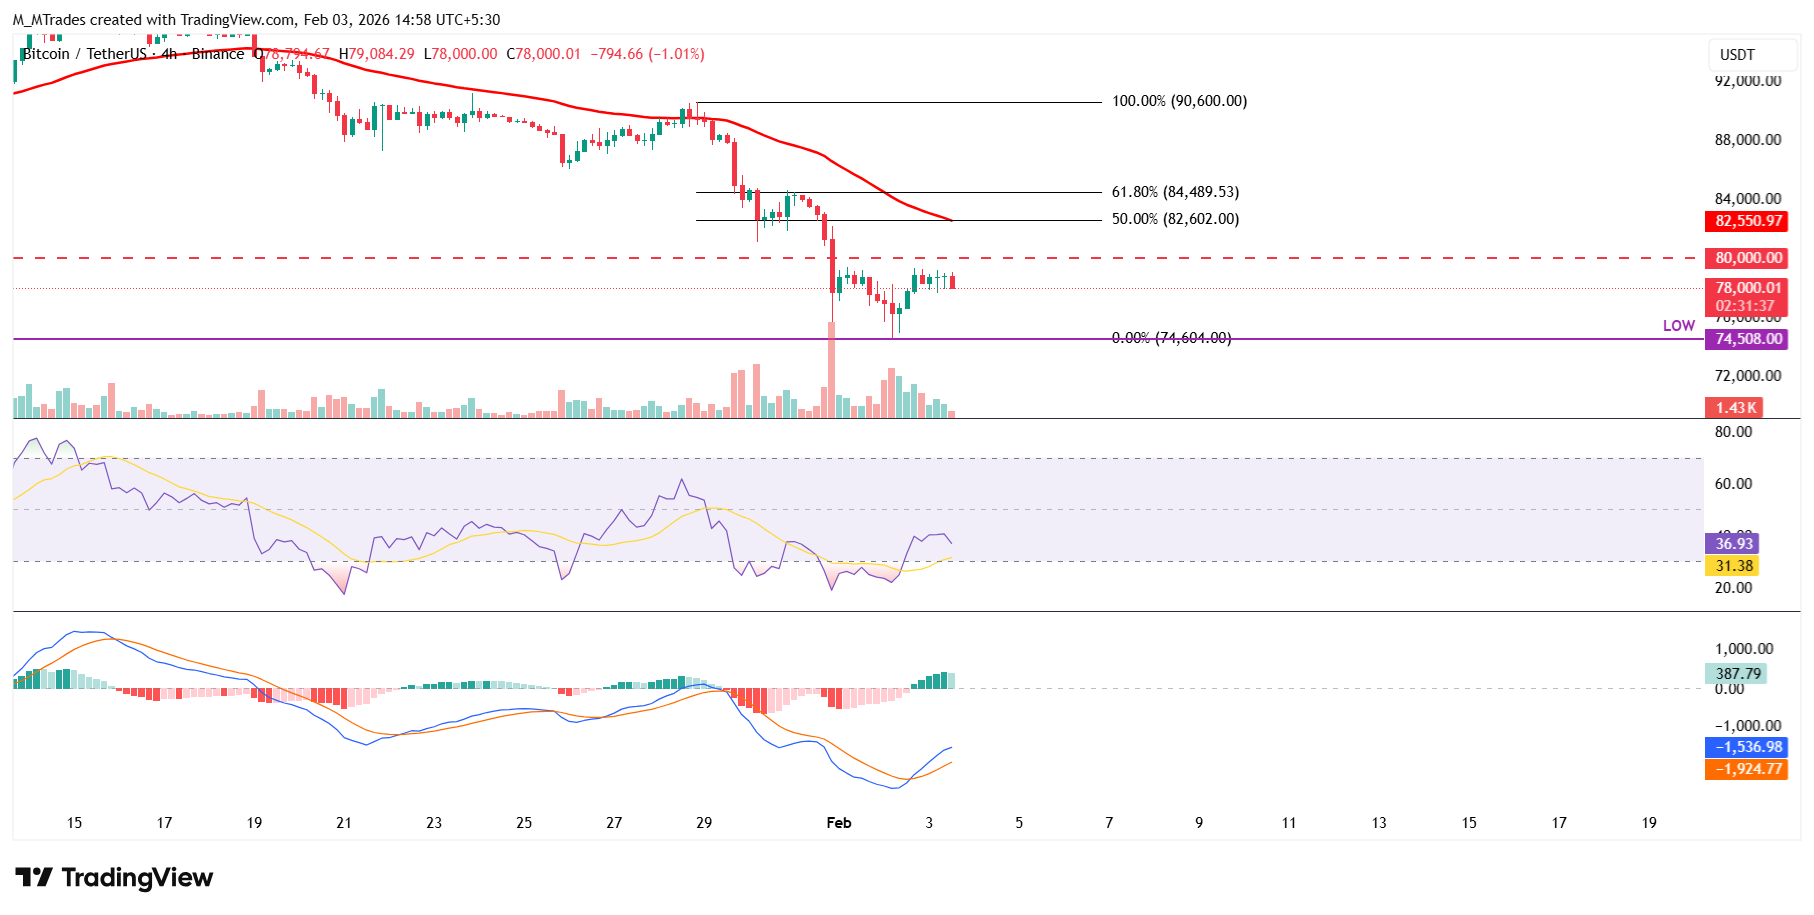
On the 4-hour chart, Bitcoin price sold off sharply after closing below the key psychological $80,000 level on Saturday, sliding to a daily low of $74,604 on Monday, just above the April 7 low and the 2025 yearly trough at $74,508. BTC then rebounded, closing 2.3% higher on Monday. At the time of writing on Tuesday, Bitcoin trades around $78,000.
If BTC continues its recovery, it could first advance toward the key psychological level at $80,000. A close above this level could extend recovery toward the 50% Fibonacci retracement level (drawn from January 28 high of $90,600 to Monday’s low of $74,604) at $82,602, which coincides with the 50-period 4-hour Exponential Moving Average (EMA).
Traders should keep in mind that the primary trend for BTC remains bearish, so any short-term recovery has a high probability to become a dead-cat bounce pattern — a brief price increase within a broader downtrend.
On the daily chart, BTC closed below the 61.8% Fibonacci retracement level (from the August 2024 low of $49,000 to the October 2025 all-time high of $126,199) at $78,490 on Sunday, and it is facing resistance around this level on Tuesday.
If BTC resumes its downward trend, it could extend the decline toward the daily support at $73,072.
The Relative Strength Index (RSI) on the daily chart reads 29, within oversold territory, indicating strong bearish momentum.
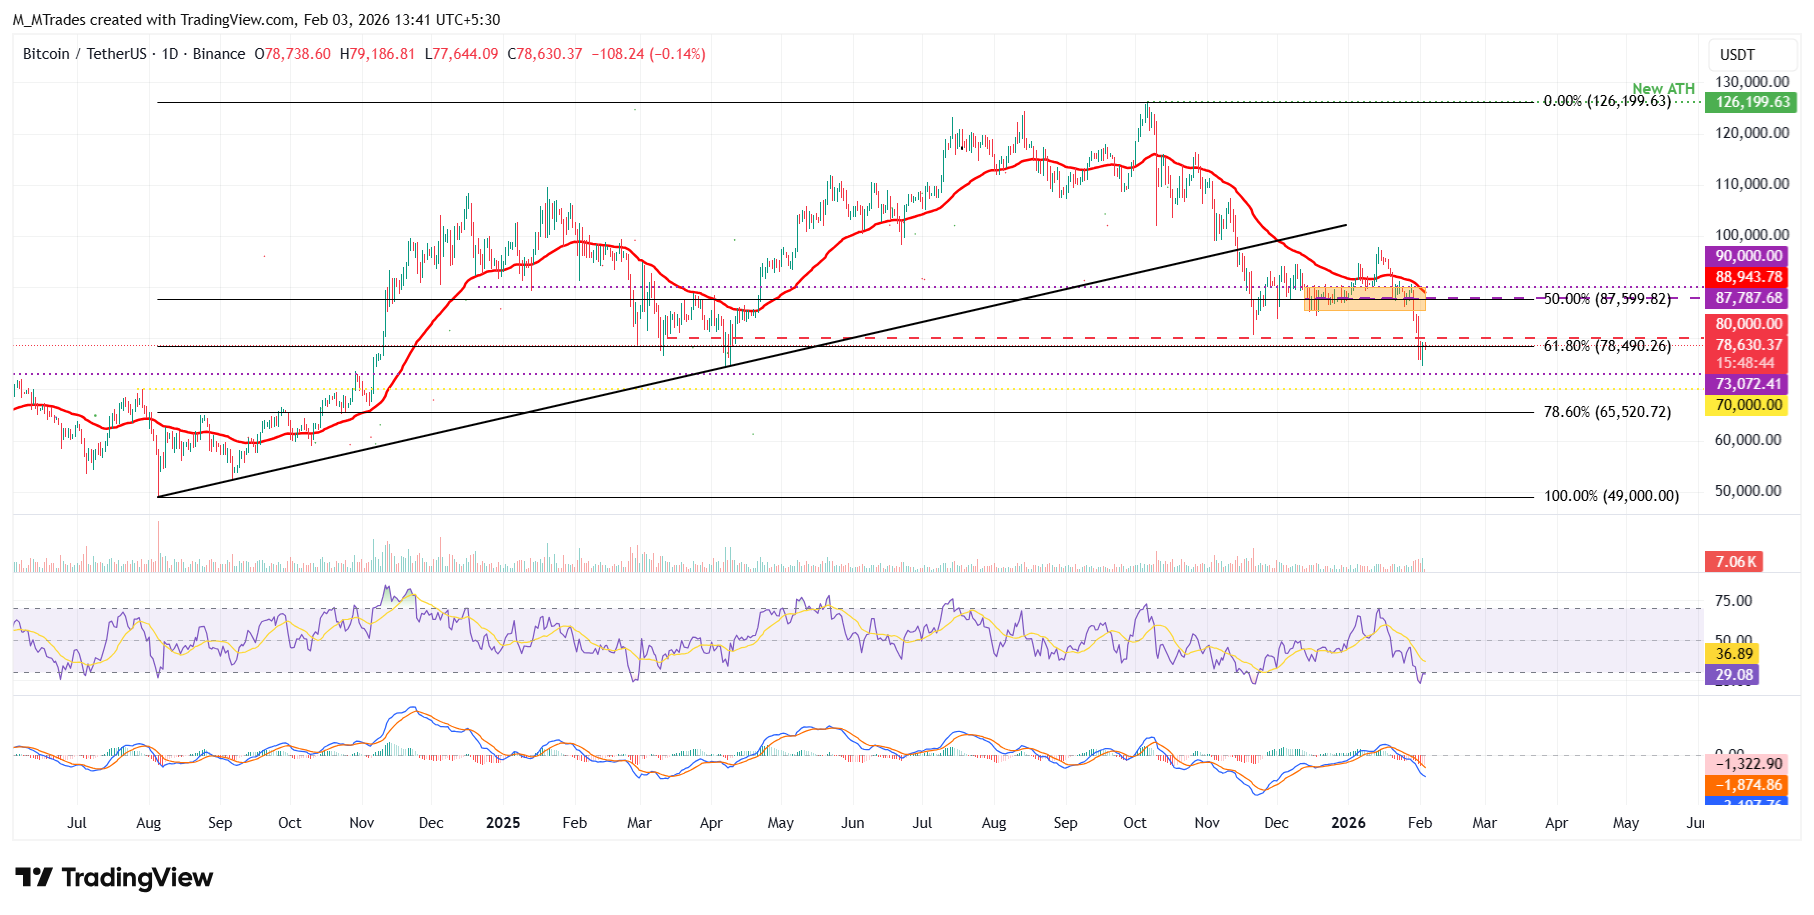
If BTC recovers, the first significant resistance emerges at $80,000, a key psychological threshold.
Bitcoin, altcoins, stablecoins FAQs
Bitcoin is the largest cryptocurrency by market capitalization, a virtual currency designed to serve as money. This form of payment cannot be controlled by any one person, group, or entity, which eliminates the need for third-party participation during financial transactions.
Altcoins are any cryptocurrency apart from Bitcoin, but some also regard Ethereum as a non-altcoin because it is from these two cryptocurrencies that forking happens. If this is true, then Litecoin is the first altcoin, forked from the Bitcoin protocol and, therefore, an “improved” version of it.
Stablecoins are cryptocurrencies designed to have a stable price, with their value backed by a reserve of the asset it represents. To achieve this, the value of any one stablecoin is pegged to a commodity or financial instrument, such as the US Dollar (USD), with its supply regulated by an algorithm or demand. The main goal of stablecoins is to provide an on/off-ramp for investors willing to trade and invest in cryptocurrencies. Stablecoins also allow investors to store value since cryptocurrencies, in general, are subject to volatility.
Bitcoin dominance is the ratio of Bitcoin's market capitalization to the total market capitalization of all cryptocurrencies combined. It provides a clear picture of Bitcoin’s interest among investors. A high BTC dominance typically happens before and during a bull run, in which investors resort to investing in relatively stable and high market capitalization cryptocurrency like Bitcoin. A drop in BTC dominance usually means that investors are moving their capital and/or profits to altcoins in a quest for higher returns, which usually triggers an explosion of altcoin rallies.
Author

Manish Chhetri
FXStreet
Manish Chhetri is a crypto specialist with over four years of experience in the cryptocurrency industry.




