|

Bitcoin Top Price Prediction: Blackrock bounce back breaks resistance, to $7,000 and beyond? – Confluence Detector

The price of Bitcoin shot higher on the news that Blackrock, the investment tycoon, has set a working group to see if cryptos have a potential. BTC/USD broke above key resistance levels that now turn into support.

The Technical Confluence Indicator shows that BTC/USD is well supported at $6,549 which is the convergence of the Fibonacci 61.8% one-week, the Simple Moving Average 5-1h, the Fibonacci 38.2% one-month, and the Bolinger Band 15m-Middle. 

Even stronger support awaits at the $6,360-to $6,412 area. Here we see a congestion of the Bolinger Band 1d-Middle, the one-day high, the SMA 100-15m, the BB 1h-Middle, the SMA 50-4h, the SMA 200-1h, the BB 15m-Lower, the SMA 200-4h, the SMA 5-4h, the Pivot Point one-day Resistance 1, the Fibonacci 23.6% one-day, the Fibonacci 38.2% one-week, and the SMA 10-4h.

The fact that BTC/USD broke above such tough resistance indicates it has momentum. So where next?

$6,867 is the confluence of the one-month high and the Bolinger Band one-day Upper. $7,028 is the Fibonacci 61.8% one-month, and only very few meaningful lines are waiting above. 

Here is how it looks on the tool:
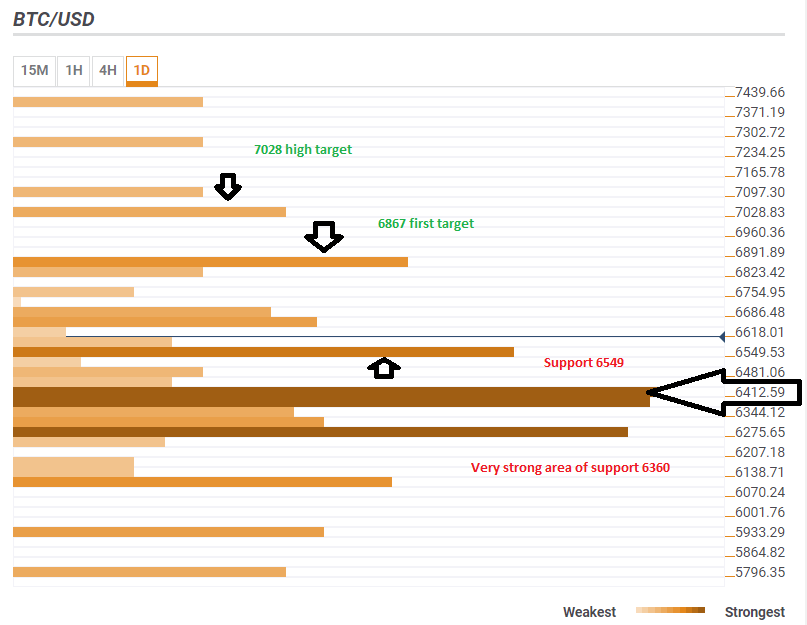
BTC USD July 16 2018 technical confluences

The Confluence Detector finds exciting opportunities using Technical Confluences. The TC is a tool to locate and point out those price levels where there is a congestion of indicators, moving averages, Fibonacci levels, Pivot Points, etc. Knowing where these congestion points are located is very useful for the trader, and can be used as a basis for different strategies.

This tool assigns a certain amount of “weight” to each indicator, and this “weight” can influence adjacents price levels. These weightings mean that one price level without any indicator or moving average but under the influence of two “strongly weighted” levels accumulate more resistance than their neighbors. In these cases, the tool signals resistance in apparently empty areas.

Learn more about Technical Confluence

More: Latest cryptocurrency news

Author

Yohay Elam

Yohay Elam

FXStreet

Yohay is in Forex since 2008 when he founded Forex Crunch, a blog crafted in his free time that turned into a fully-fledged currency website later sold to Finixio.


More from Yohay Elam
Share:

Editor's Picks

Pepe Price Forecast: PEPE signals trend reversal amid a short squeeze

Pepe price is up nearly 30% in the last 24 hours, outperforming most top cryptocurrencies and hinting at further upside potential. Derivatives data suggest a short squeeze of more than $2 million during the same period, forcing traders to buy back positions in the meme coin. The technical outlook for PEPE indicates an upside bias as bullish momentum strengthens.

Crypto Overview: Bitcoin tops $85,000 post-CLARITY Act failure – TAO and FET lead gains

Bitcoin price trades above $85,000 maintaining a constructive tone amid positive institutional inflows, Strategy’s first BTC purchase since August, and alternative regulatory expansions following the CLARITY Act's failure. AI tokens such as Bittensor (TAO) and FET have emerged as top performers over the last 24 hours.

Ripple and Stellar outlook: Momentum improves as bulls target further gains

Ripple (XRP) and Stellar (XLM) stabilize after extending their gains by nearly 9% at the start of the week. Improving momentum indicators support XRP and XLM bullish price action and hint at further rally. Meanwhile, traders should remain cautious as mixed derivatives data could limit upside as both tokens try to sustain their recent upswing.

Ethereum Price Forecast: ETH rallies above $2,700 as investors shrug off bearish sentiment

Ethereum climbed above $2,700 on Monday after investors defended the realized price level despite negative sentiment over the Clarity Act's failure and the Federal Reserve rate hike. After the Clarity Act failed to advance in the Senate, ETH dipped below $2,400 last week. But right below that price is the top altcoin's realized price, or average on-chain cost basis, at $2,310.

Bitcoin: BTC shrugs off CLARITY Act setback and hawkish Fed
Bitcoin (BTC) price action has remained resilient this week, trading above $78,000 at the time of writing on Friday, heading toward a key resistance zone. Institutional demand shows early signs of weakness, with spot Exchange Traded Funds (ETFs) on track for a second straight week of outflows, with over $420 million recorded through Thursday amid escalating Middle East tensions.