Bitcoin Technical Analysis: BTC/USD selling pressure is far from over, as bears lock sights on $6000
- Bitcoin downside pressure has resumed on Thursday, nursing losses of 0.3%.
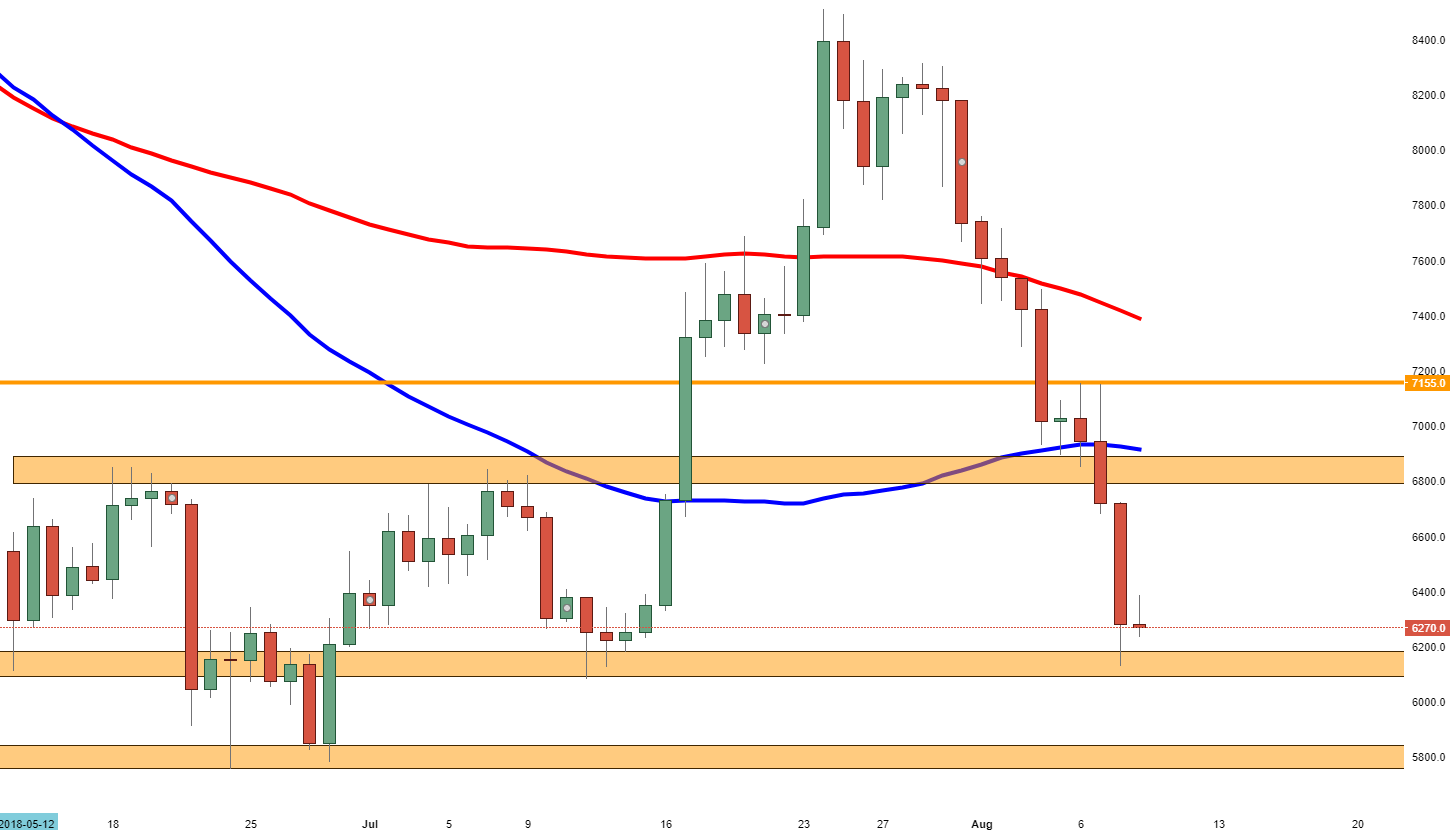
- BTC/USD is heading for another key demand zone, which is seen just ahead of the $6000 figure.

BTC/USD daily chart
Spot rate: 6257.3
Relative change: -0.37%
High: 6384.7
Low: 6230.9
Trend: Bearish
Support 1: 6180-6090.0, demand area ahead of big 6000 level.
Support 2: 6000.0, psychological support.
Support 3: 5800.0, (support on daily chart).
Resistance 1: 6405.5, (resistance on daily chart).
Resistance 2: 6650.0, supply zone.
Resistance 3: 6840.0, 7th July high.
Author

Ken Chigbo
Independent Analyst
Ken has over 8 years exposure to the financial markets. He started his career as an analyst, covering a variety of asset classes; forex, fixed income, commodities and equities.
More from Ken Chigbo


