|

Bitcoin technical analysis: BTC/USD could have a very fast fall down to $5000

  • Bitcoin price is trading in positive territory, up some 3.60% in the second half of the session. 
  • BTC/USD has aggressively been pushing to the downside since 27 October. 
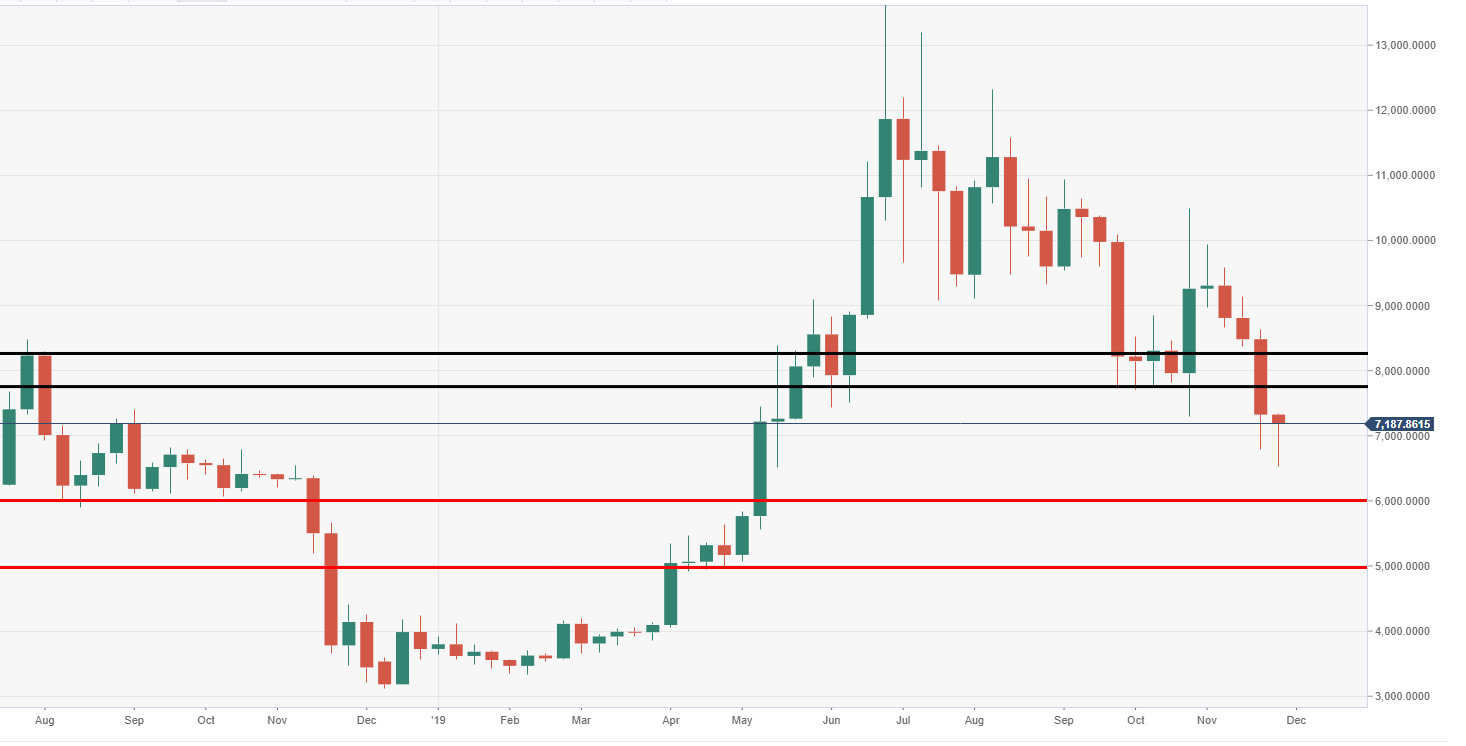
  • The price remains at risk of falling to the next major demand area at $5000. 

BTC/USD weekly chart

The price is running towards its fourth consecutive week in the red. 
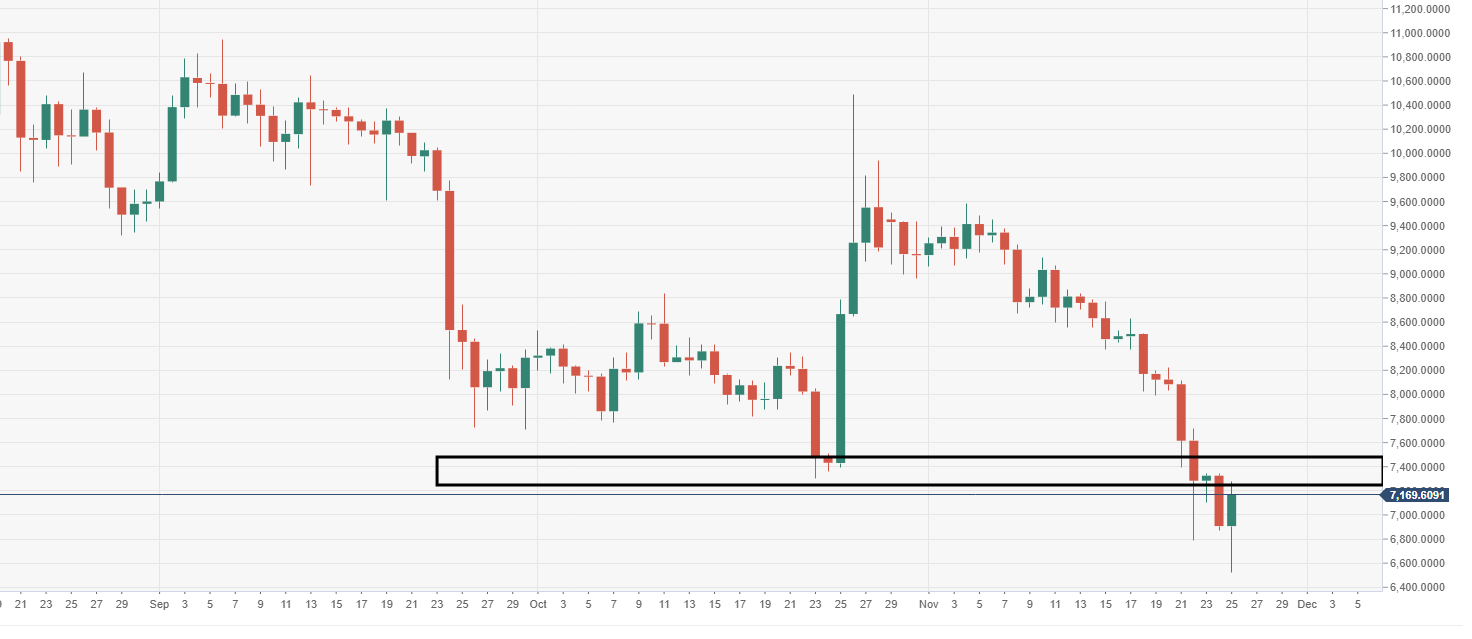
BTC/USD daily chart

Price action is moving within a critical demand zone, $7300-6900, a break could invite a fresh wave of selling. 

Spot rate:                  7156.42 

Relative change:       +3.60%

High:                          7276.19

Low:                           6,526.81

BTC/USD

Overview
Today last price7176.62
Today Daily Change268.89
Today Daily Change %3.89
Today daily open6907.73
 
Trends
Daily SMA208459.27
Daily SMA508432.81
Daily SMA1009147.99
Daily SMA2009344.04
 
Levels
Previous Daily High7344.35
Previous Daily Low6867.95
Previous Weekly High8633.09
Previous Weekly Low6787.81
Previous Monthly High10484.7
Previous Monthly Low7300.54
Daily Fibonacci 38.2%7049.94
Daily Fibonacci 61.8%7162.37
Daily Pivot Point S16735.67
Daily Pivot Point S26563.61
Daily Pivot Point S36259.26
Daily Pivot Point R17212.07
Daily Pivot Point R27516.42
Daily Pivot Point R37688.48

Author

Ken Chigbo

Ken Chigbo

Independent Analyst

Ken has over 8 years exposure to the financial markets. He started his career as an analyst, covering a variety of asset classes; forex, fixed income, commodities and equities.

More from Ken Chigbo
Share:

Editor's Picks

Bitcoin slips below $90,000 as Trump's tariffs swing, ETF outflows pressure price

Bitcoin price struggles below $90,000 on Friday, correcting nearly 5% so far this week. Trump’s Davos speech on Wednesday, backing away from imposing further tariffs on the EU, triggered market volatility and risk-on mood.

Ripple holds losses above $1.90 amid mild ETF inflows, muted retail interest

Ripple is trading under pressure, hovering above the immediate support level at $1.90 at the time of writing on Friday. Despite mild inflows into spot ETFs, XRP has declined for a second consecutive day, reflecting weak retail demand and persistent selling pressure.

Pump.fun sees bearish reversal despite buyback

Pump.fun trades below $0.0025 at the time of writing on Friday, after a nearly 7% decline from the 50-day Exponential Moving Average at $0.002601. The recent purchase of over $1 million in PUMP tokens failed to revive retail support, as PUMP futures continue to see capital outflow.

Crypto Today: Bitcoin, Ethereum, XRP face elevated downside risk amid weak technical setups

Bitcoin is struggling to stay above support at $89,000 at the time of writing, as headwinds intensify across the cryptocurrency market on Friday. Ethereum and Ripple are facing low retail and institutional demand, while bearish indicators continue to flash subtle signals that losses may extend further.

Bitcoin Price Annual Forecast: BTC holds long-term bullish structure heading into 2026

Bitcoin (BTC) is wrapping up 2025 as one of its most eventful years, defined by unprecedented institutional participation, major regulatory developments, and extreme price volatility.

Bitcoin: BTC slips below $90,000 as Trump's tariffs swing, ETF outflows pressure price

Bitcoin (BTC) is trading below $90,000 at the time of writing on Friday, down nearly 5% this week. Despite a brief improvement in risk appetite following US President Donald Trump’s mid-week speech at Davos, the Crypto King remains under pressure as institutional demand continued to weaken so far this week.