Bitcoin Technical Analysis: BTC/USD bull flag formation, pending a breakout higher, one more push below chunky sell zone at $7,600 territory
- Bitcoin price stagnates after 5% rally from the lows printed at $7042, there may still be room for another push.
- BTC/USD is just 1.5% from running into a supply zone again, within the early $7600 area.
- Price action has within recent trading formed a bullish flag pattern, pending a potential breakout to the upside.

BTC/USD 30-minute chart
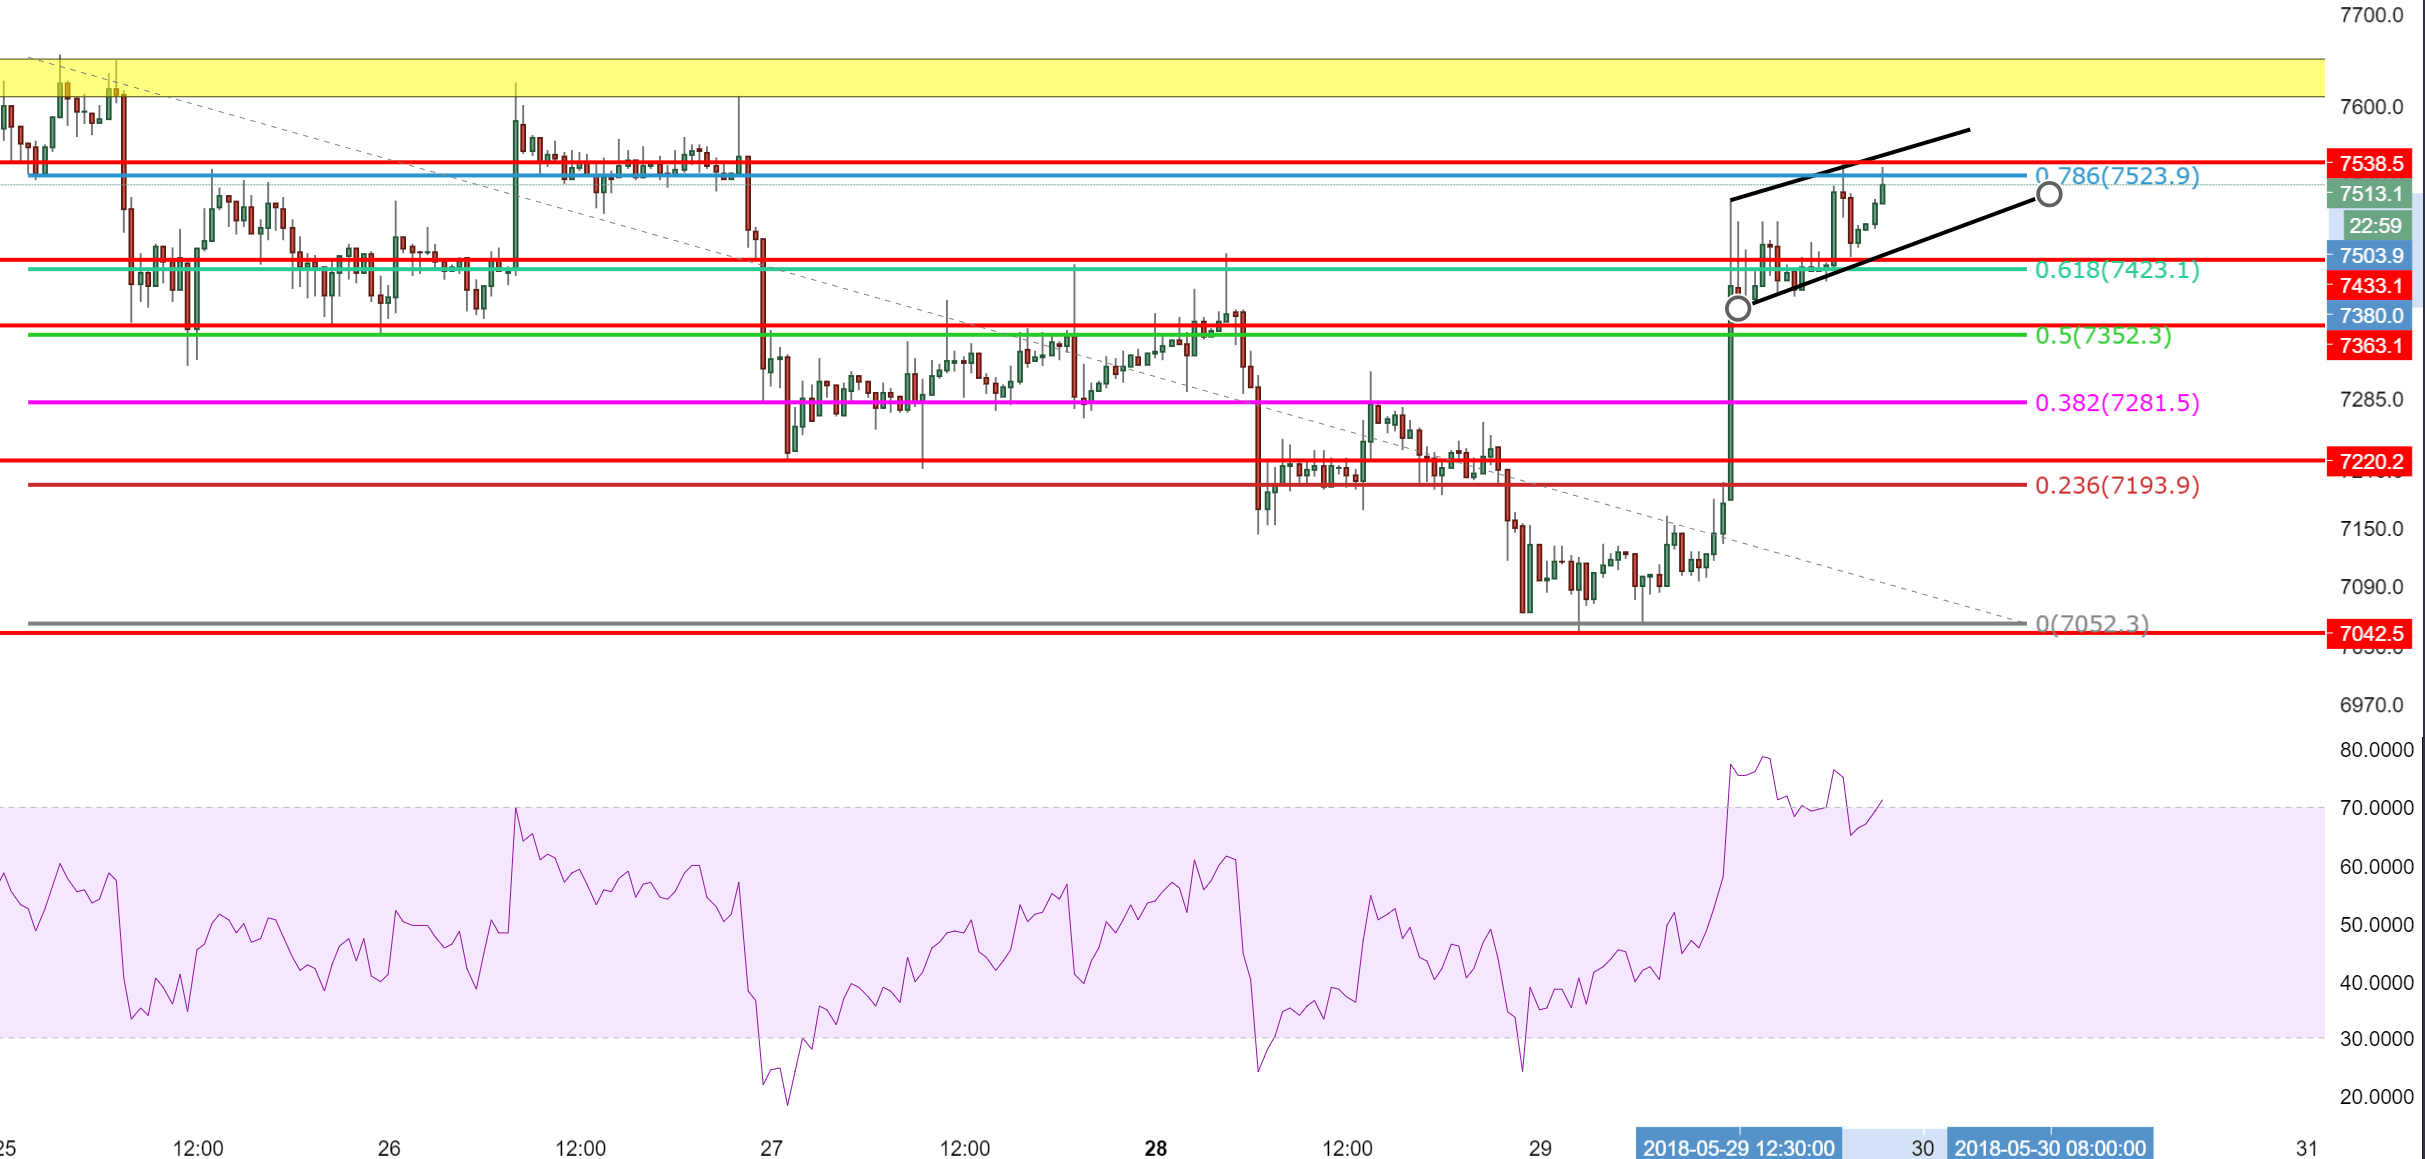
Spot rate: 7,490.00
Relative change: +5.54%
High: 7,538.50
Low: 7,042.50
Trend: Bullish
Resistance 1: 7,525.00, upper trend line of bull flag & 78.6% Fibonacci
Resistance 2: 7,600.00, heavy supply zone
Resistance 3: 7,730.00, 24th May high
Support 1: 7,433.10, 61.8% Fibonacci
Support 2: 7,361.10, 50% Fibonacci & 25 / 26th May lows
Support 3: 7,282.20, 38.2% Fibonacci
Author

Ken Chigbo
Independent Analyst
Ken has over 8 years exposure to the financial markets. He started his career as an analyst, covering a variety of asset classes; forex, fixed income, commodities and equities.


