Bitcoin price still stuck in downtrend to $32,649 despite flairs of good news
- Bitcoin price is making lower highs and higher lows, performing a squeeze.
- BTC price action is overall still in a downtrend and could be set for more downside towards January lows.
- All will depend on where Bitcoin will open on Monday and the next steps for investors going forward.

Bitcoin (BTC) price action is set to print another positive week, but on its own, that is considered a positive thing. But overall, actual price action is going nowhere with BTC rather trading sideways and price action getting squeezed from both sides with lower highs and higher lows. Technically, Bitcoin is still in a downtrend, and against the economic and geopolitical background, it looks as BTC investors will remain sidelined until things clear up before pushing Bitcoin back up towards $60,000 in the longer term.
Bitcoin price set to trade sideways to lower into next week as tail risk persists and grows
Bitcoin price sees bulls printing some green numbers for this week, but all in all, price action remains pretty muted, with no lows or highs against the move from the previous week. Expect to see Bitcoin moving in bandwidth between $36,709 and $44,088, a 20% range that will only start to trade smaller by the end of next week, set for a breakout. Considering the death cross, the stagflation fears for the eurozone and spillover to the whole globe, the downtrend will still be very much in play and could start to weigh further, resulting in a breakout to the downside.
BTC price action will start to test the lower range next week, around $36,709 and the monthly S1 support level. Expect to see price action start dropping fastest as losses are deepened and could be set to test $32,649, which would be a test of the low of 2022 and possibly print a new low for the year, breaking the one from mid-January. With this, Bitcoin price will enter a sharp correction phase and start to trade in the distribution zone used in 2021 before the big rally in the fall last year.
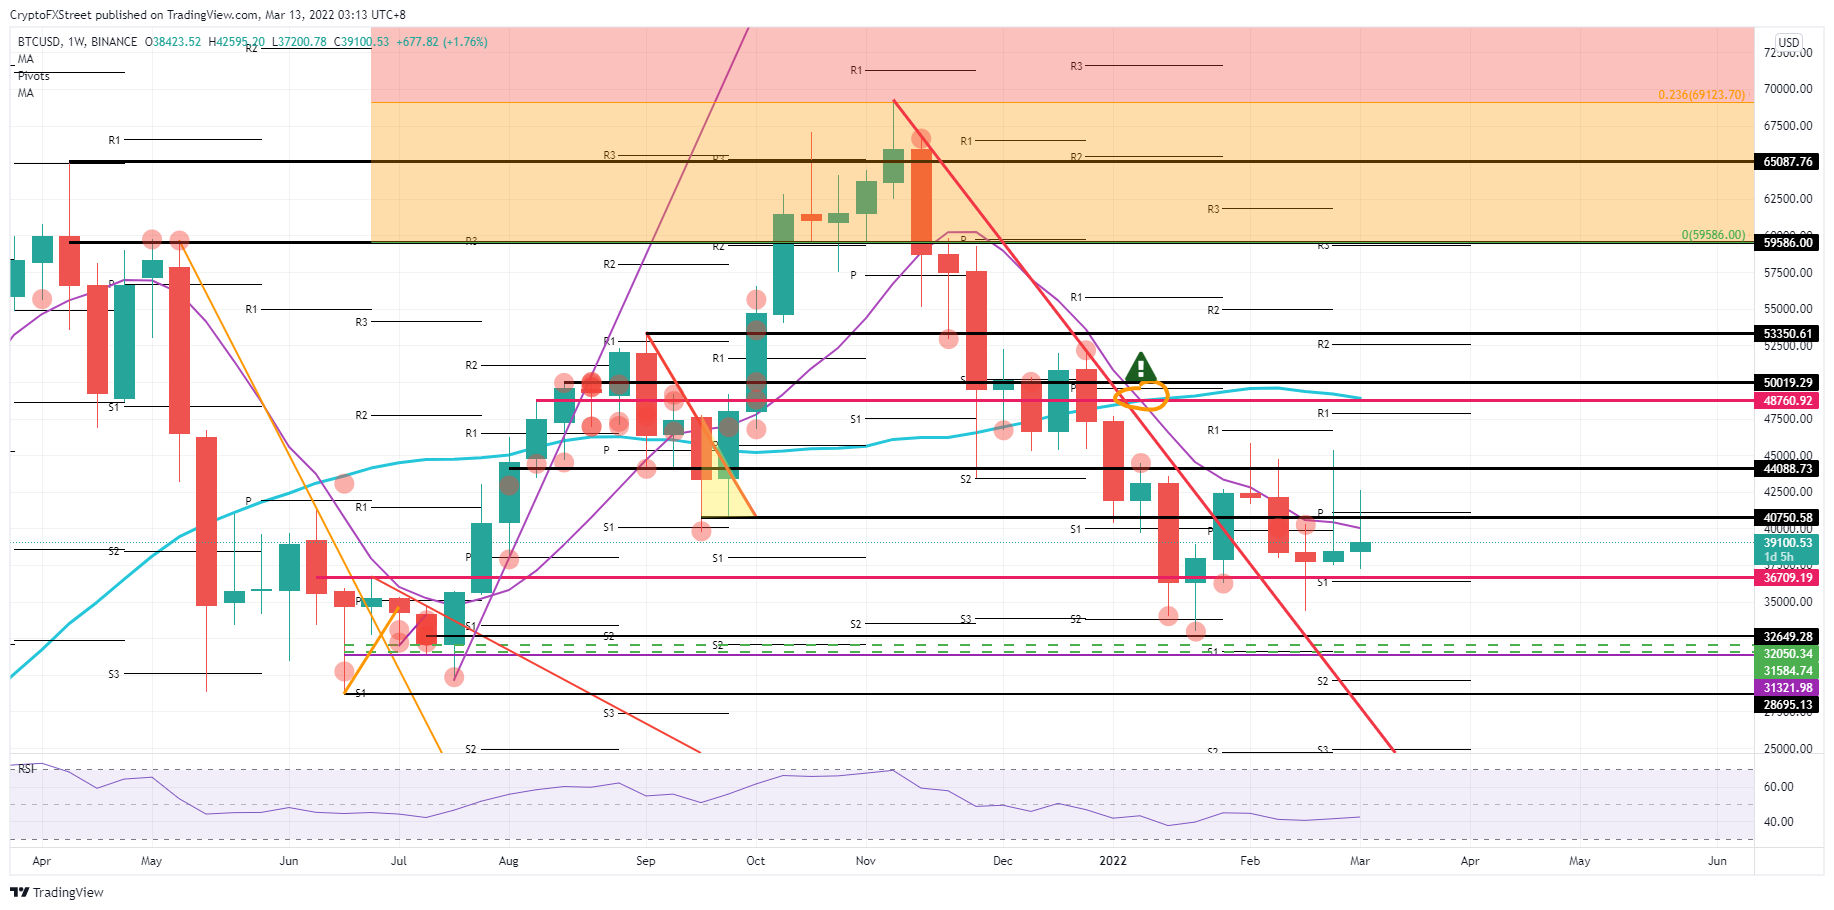
BTC/USD weekly chart
As Bitcoin price needs to factor in many geopolitical and economic factors into its tail risk, a fade of just one of those elements would tilt the balance into the camp of the bulls and investors. That would be translated into a jump in price action towards $44,088 in a first phase, next up for grabs is $48,000 with the monthly R1 resistance level and just above there a historic pivotal level and the 200-day Simple Moving Average (SMA) that will be key see how bulls will react nearing that level, as 23% of gains will be in the books. In case bulls would be able to sit on their hands and refrain from too much profit-taking, $60,000 could be in the cards if more tailwinds were added to the trade.
Author

Filip Lagaart
FXStreet
Filip Lagaart is a former sales/trader with over 15 years of financial markets expertise under its belt.


