Bitcoin price sinks to $46.7K despite record accumulation and supply shock events

Bitcoin (BTC) saw fresh local lows on Aug. 31 as limp price action diverged further from bullish sentiment.
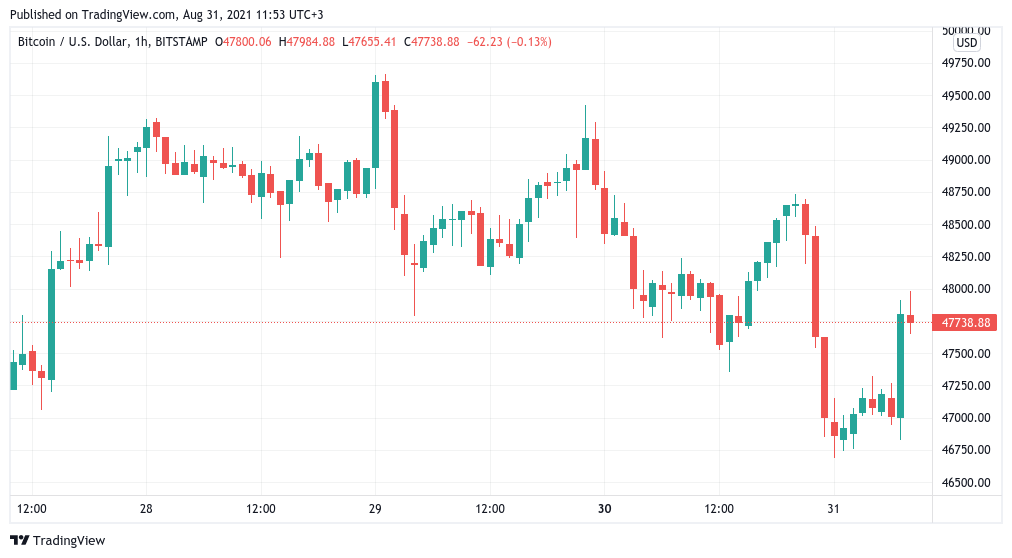
BTC/USD 1-hour candle chart (Bitstamp). Source: TradingView
Bitcoin evades bullish continuation
Data from Cointelegraph Markets Pro and TradingView showed BTC/USD reversing at $46,700 on Bitstamp after dropping $2,000 in hours.
Part of a multi-day rangebound construction, the dip resulted in a push towards $48,000, with bulls still unable to gather momentum for an attack on $50,000.
For popular trader Crypto Ed, $48,200 was the level to watch for continuation upwards.
“Showing some tricky moves, retest failed overnight with that dump,” he commented on the hourly chart.
“Right now busy to print a Bart pattern. Still having the same view: reclaim that first horizontal and we're good to go.”
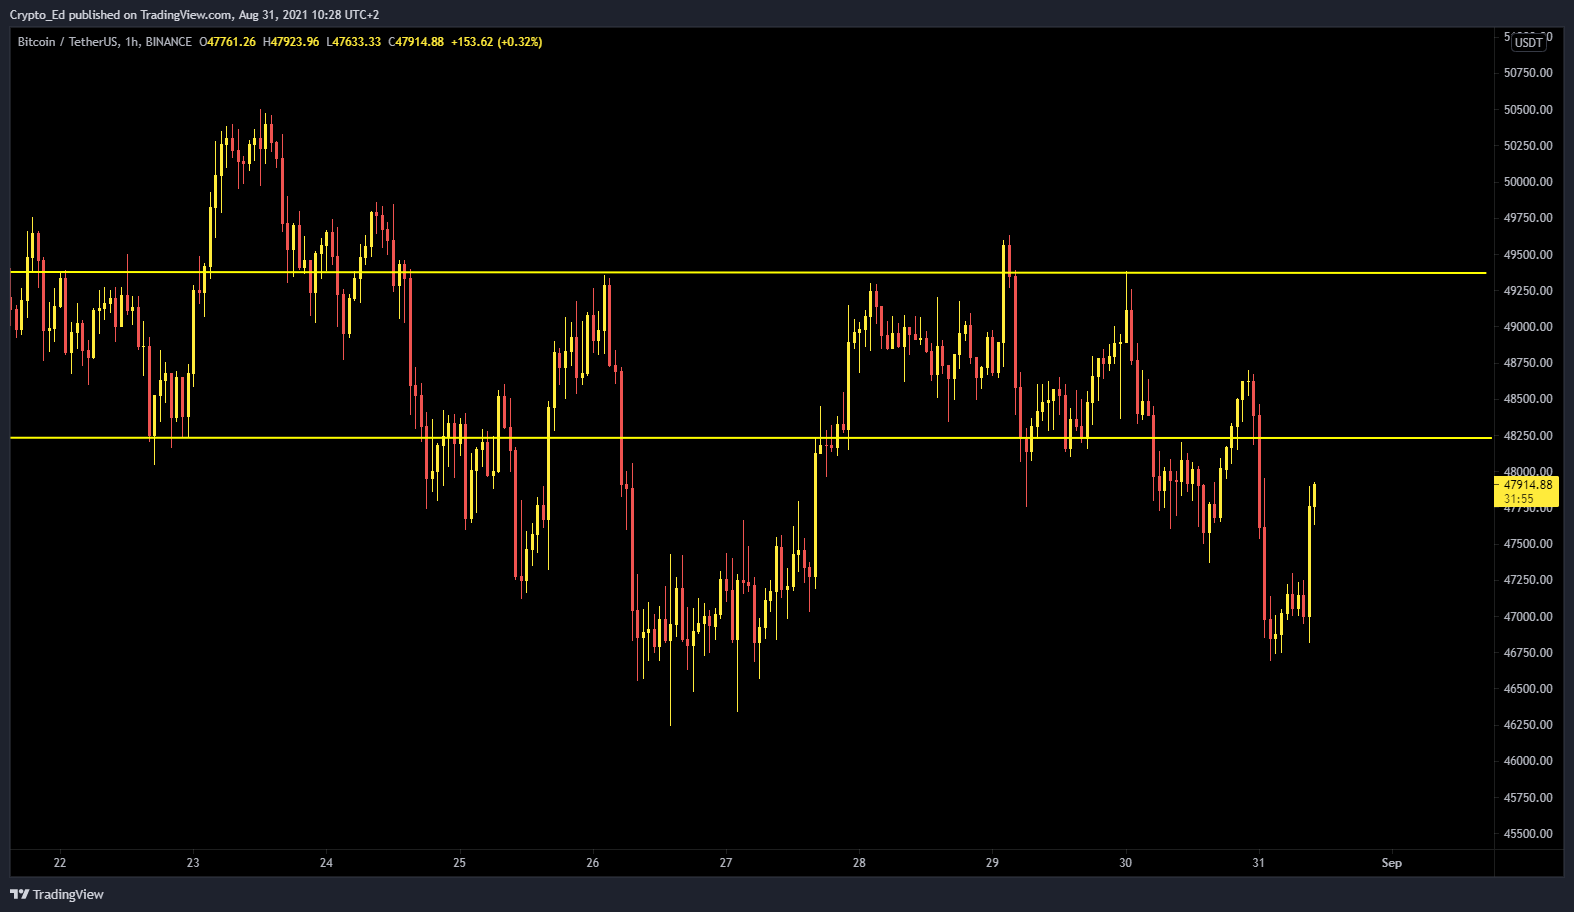
BTC/USDT annotated 1-hour candle chart (Binance). Source: Crypto Ed/ Twitter
The mood among analysts broadly stayed optimistic on the day despite price action lagging any noticeable improvement in market activity.
Some highlighted conspicuous accumulation at current levels, while on-chain metrics such as illiquid supply were also a talking point.
“This wave of Bitcoin supply shock has the most momentum of any in recent history,” William Clemente, lead insights analyst at Blockware, noted.
“We're going much higher over the coming months.”
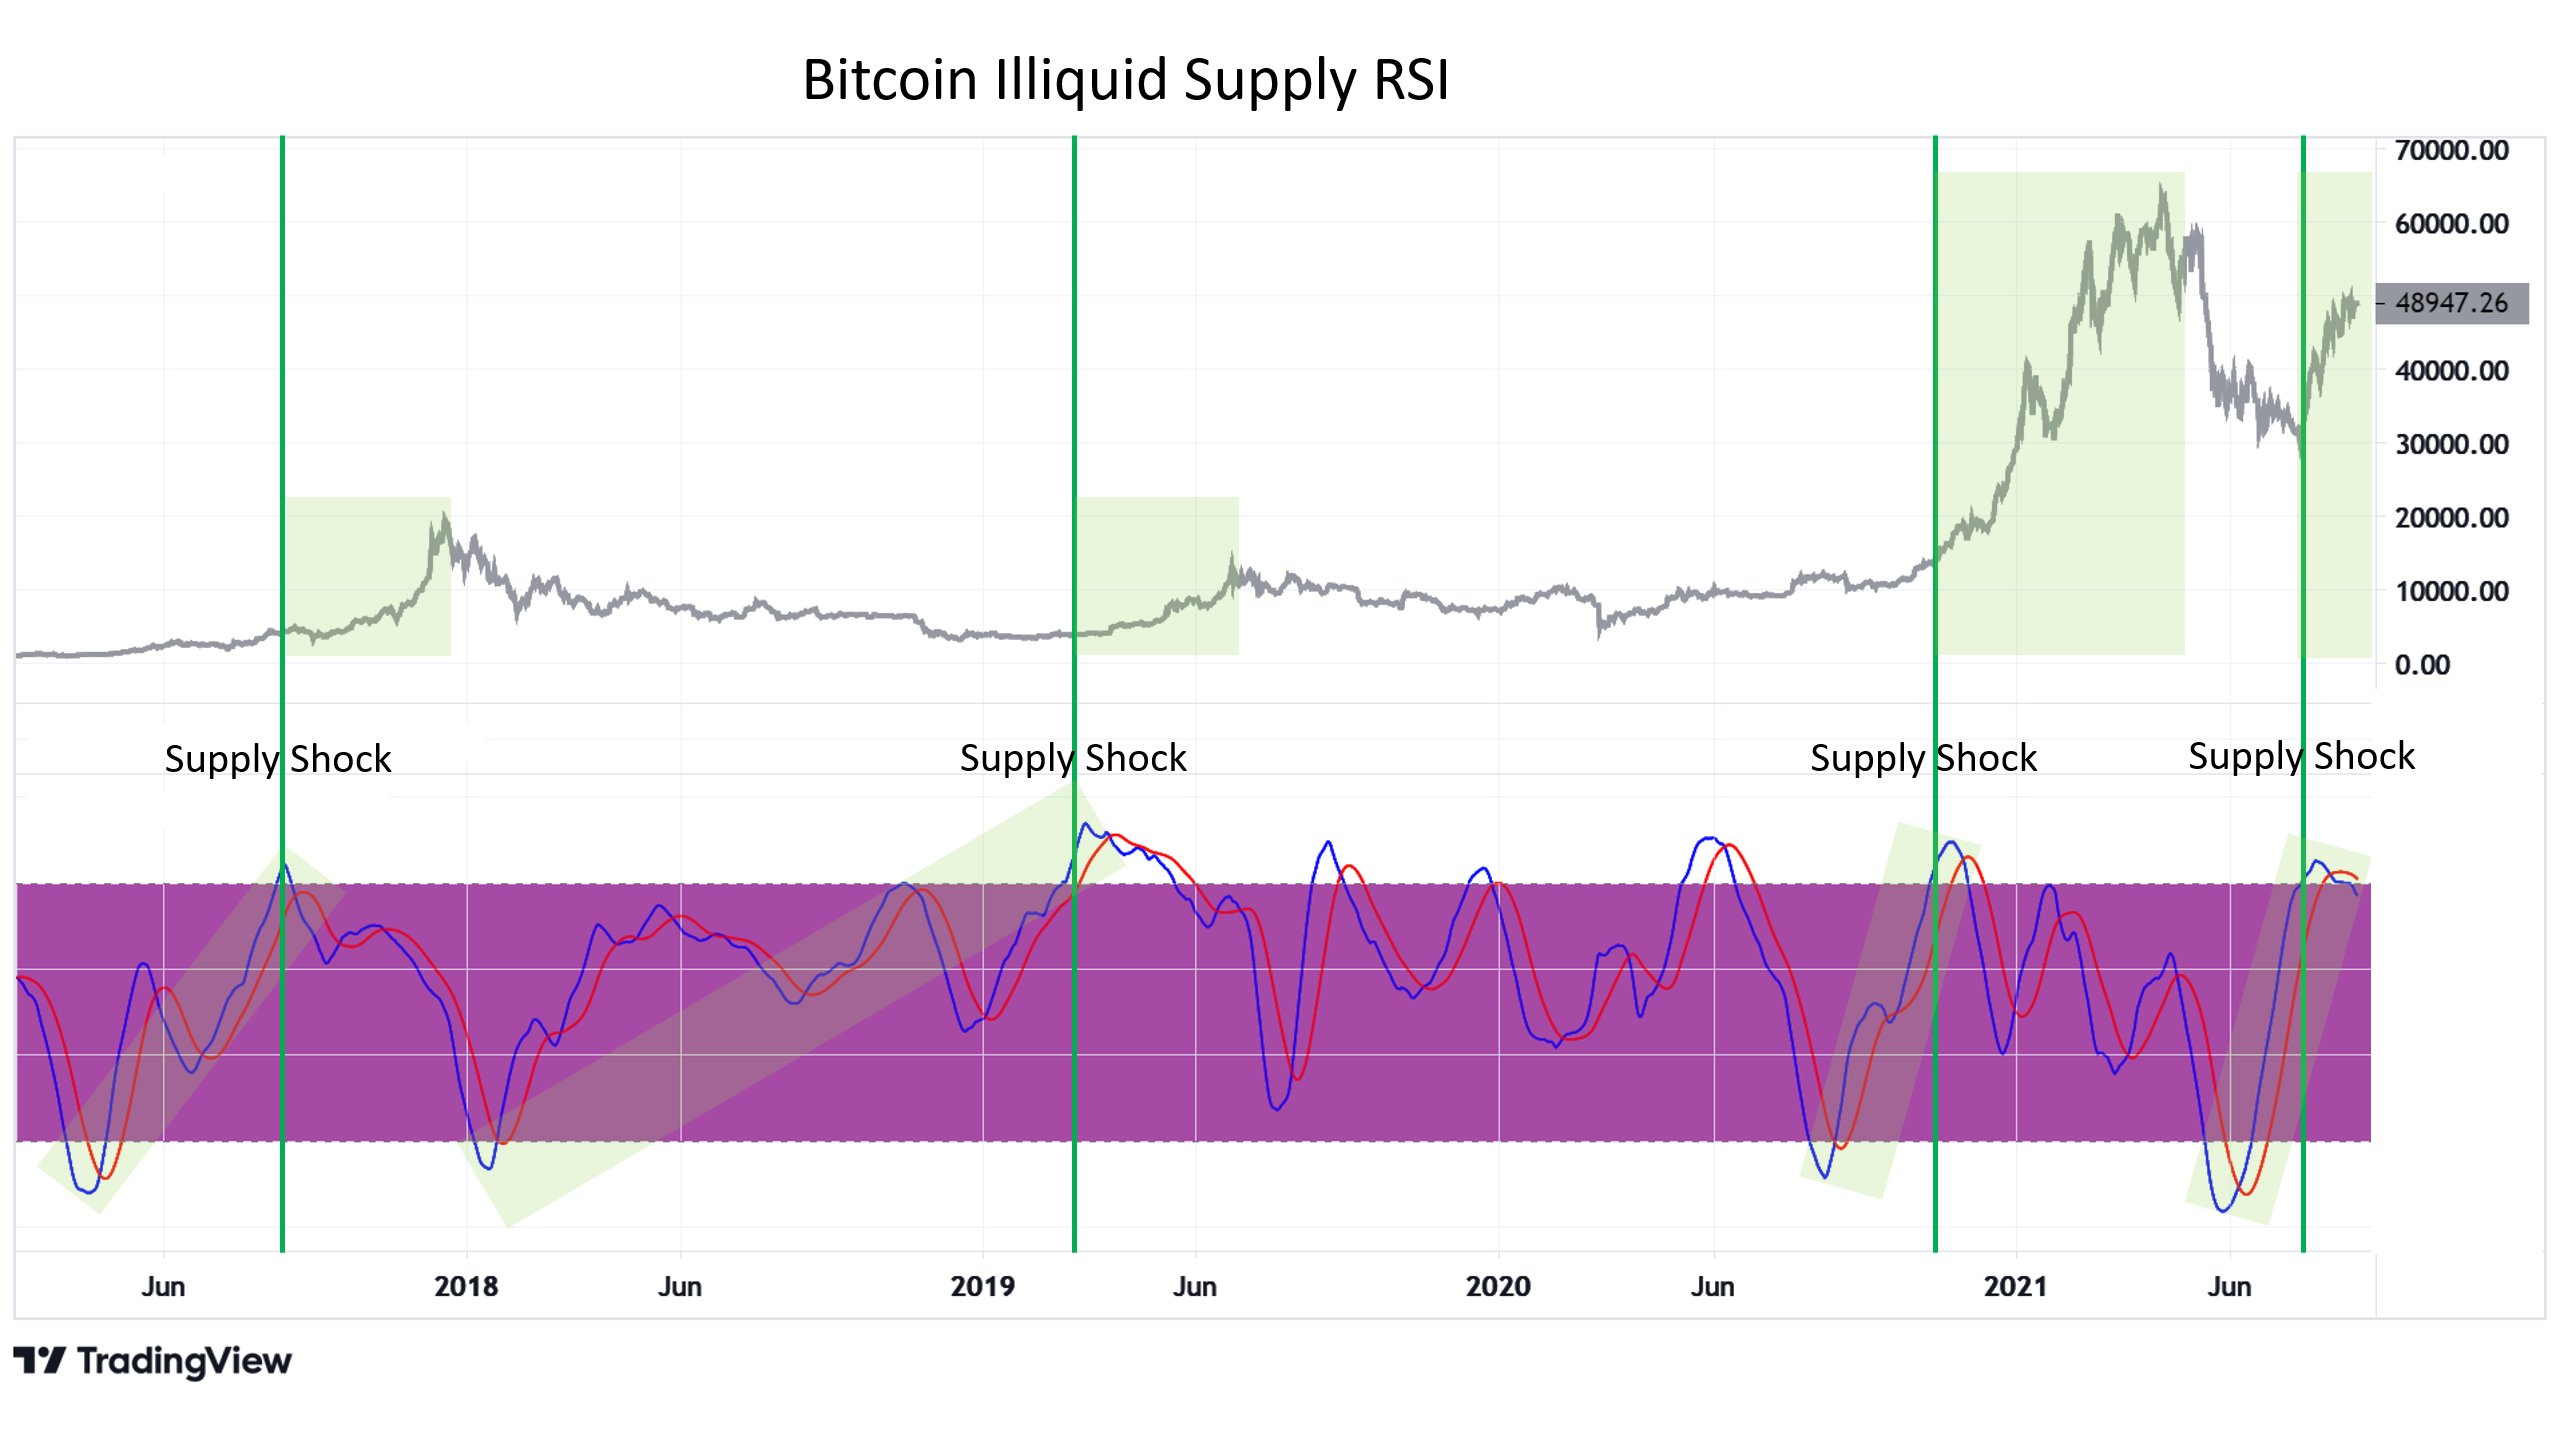
Bitcoin illiquid supply relative strength index vs. BTC/USD chart. Source: William Clemente/ Twitter
Ethereum on the move
On altcoins, Solana (SOL) and Polkadot (DOT) were the standouts in the top ten cryptocurrencies by market cap.
SOL/USD continued making new highs, gaining 19% on the day to near $120, while DOT/USD added 9.2%.
Ether (ETH) was also on the move, up 5% at the time of writing and above $3,350 in what Cointelegraph contributor Michaël van de Poppe described as a "bullish" market.
"Ethereum bouncing from support as well on the $BTC pair. Looking good," he added.
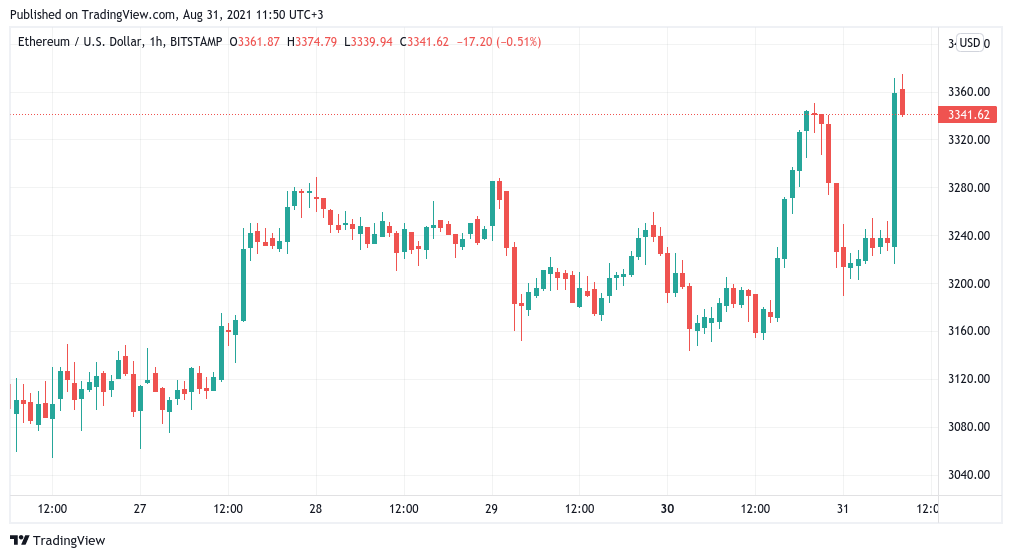
ETH/USD 1-hour candle chart (Bitstamp). Source: TradingView
Author

Cointelegraph Team
Cointelegraph
We are privileged enough to work with the best and brightest in Bitcoin.


