Bitcoin price prediction: One step at a time takes BTC/USD closer to $4,000 – Confluence Detector


  • Bearish and bullish pressure cancels out amid declining trading activity.
  • Bitcoin recently added significantly to its value jumping above $4,000.
  • There are just about the same resistance levels for Bitcoin as they are support levels.

The bear pressure and the bullish pressure appear to be canceling out as Bitcoin maintains the position above $3,800. Bitcoin recently added significantly to its value and jumped above $4,000. Bitcoin bulls confidence increased as buying entries skyrocketed. Bitcoin zoomed towards $4,200 but formed a high around $4,187 before it crashed towards the main support at $3,700.

Confluence Indicator technical levels

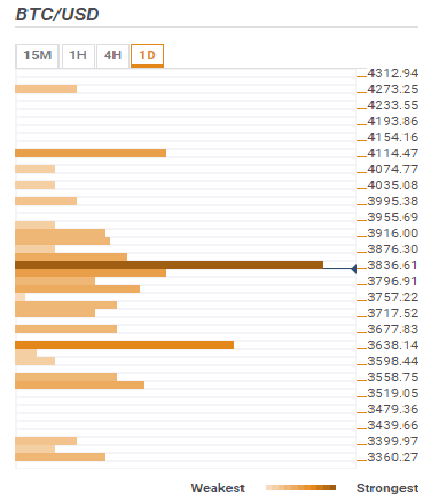
According to the confluence detector tool, there are just about the same resistance levels for Bitcoin as they are support levels. However, the bulls must brace themselves to overcome the main resistance level at $3,836.61. - $3,876.30 to open Bitcoin price path to $4,000.

These are the confluence resistance levels to look out for in the coming sessions: $3,836.61. - $3,876.30, $3,916.00 - $3,955.69 and $4,114.47 - $4,154.16.

  • $3,836.61. - $3,876.30: The 5-day Simple Moving Average (SMA) 15-minutes chart, the 61.8% Fibonacci 1-minute chart. The 10-SMA 15-minutes chart, the previous high on the 15’ chart, the Bollinger Band 15’ middle curve, the 5-day SMA 1-hour chart, the 38.2$ Fib level weekly chart, the previous high 1-day chart and the Bollinger Band 15’ upper curve.
  • $3,916.00 - $3,955.69: Pivot Point 1 Month R1.
  • $4,114.47 - $4,154.16: Pivot Point 1 week R1 and the previous Month High.

These are the confluence support levels to look out for in the short-term: $3,796.91- $3,757.22, $3,717.52 -$3,677.83 and $3,638.14 - $3,558.75.

  • $3,796.91- $3,757.22: The 23.6% Fib retracement level on the daily chart, the 100-day SMA daily chart and the Bollinger Band 1-hour lower curve.
  • $3,717.52 -$3,677.83: The Bollinger Band daily chart middle curve, the pivot point 1-day S1, the previous low on the daily chart and the pivot point monthly chart R1.
  • $3,638.14 - $3,558.75: 50-day SMA daily chart, the 38.2% Fib level monthly chart, the 200-day SMA 4-hour chart, pivot point 1 day S2 the previous week low and the 161.8% Fibo on the daily chart.

BTC/USD daily confluence detector 


Get 24/7 Crypto updates in our social media channels: Give us a follow at @FXSCrypto and our FXStreet Crypto Trading Telegram channel


Information on these pages contains forward-looking statements that involve risks and uncertainties. Markets and instruments profiled on this page are for informational purposes only and should not in any way come across as a recommendation to buy or sell in these assets. You should do your own thorough research before making any investment decisions. FXStreet does not in any way guarantee that this information is free from mistakes, errors, or material misstatements. It also does not guarantee that this information is of a timely nature. Investing in Open Markets involves a great deal of risk, including the loss of all or a portion of your investment, as well as emotional distress. All risks, losses and costs associated with investing, including total loss of principal, are your responsibility. The views and opinions expressed in this article are those of the authors and do not necessarily reflect the official policy or position of FXStreet nor its advertisers. The author will not be held responsible for information that is found at the end of links posted on this page.

If not otherwise explicitly mentioned in the body of the article, at the time of writing, the author has no position in any stock mentioned in this article and no business relationship with any company mentioned. The author has not received compensation for writing this article, other than from FXStreet.

FXStreet and the author do not provide personalized recommendations. The author makes no representations as to the accuracy, completeness, or suitability of this information. FXStreet and the author will not be liable for any errors, omissions or any losses, injuries or damages arising from this information and its display or use. Errors and omissions excepted.

The author and FXStreet are not registered investment advisors and nothing in this article is intended to be investment advice.

Join Telegram

Recommended content


Recommended Content

Editors’ Picks

MANTA suffers 4% pullback after unlocking tokens worth $40 million

MANTA suffers 4% pullback after unlocking tokens worth $40 million

Manta Network (MANTA) unlocked over 8% of its circulating supply on Thursday. The unlocked tokens were airdropped and distributed in public sale, according to data from Tokenunlocks. 

More Cryptocurrencies News

XRP struggles to recover as lingering Ripple lawsuit could reach Supreme Court, former SEC litigator says

XRP struggles to recover as lingering Ripple lawsuit could reach Supreme Court, former SEC litigator says

The SEC vs. Ripple potential showdown at the Supreme Court is likely, says former SEC litigator Ladan Stewart. XRP Ledger calls developers, businesses and investors to build on the blockchain, extending Apex 2024 registration until April 30. 

More Ripple News

Bitcoin Layer 2 Merlin chain TVL climbs 20%, defying broad market correction

Bitcoin Layer 2 Merlin chain TVL climbs 20%, defying broad market correction

Merlin chain’s TVL added 20% this week, and crossed $800 million on Thursday. Bitcoin Layer 2 assets noted double-digit losses in the past week. Stacks, Elastos, SatoshiVM, BVM are hit by a correction as Bitcoin hovers around $61,000. 

More Bitcoin News

If Bitcoin restarts bull run, these altcoins are likely to explode Premium

If Bitcoin restarts bull run, these altcoins are likely to explode

If Bitcoin’s consolidation ends and the bull run resumes, altcoins are likely going to trigger a massive rally. Last cycle’s hot tokens like SOL, AVAX, WIF, ONDO, etc., could see renewed enthusiasm. 

More Cryptocurrencies News

Bitcoin: BTC’s rangebound movement leaves traders confused

Bitcoin: BTC’s rangebound movement leaves traders confused

Bitcoin (BTC) price has been hovering around the $70,000 psychological level for a few weeks, resulting in a rangebound movement. This development could lead to a massive liquidation on either side before a directional move is established. 

Read full analysis

BTC

ETH

XRP