- Bitcoin price meets a suppressive force near the $24,000 level.
- BTC price shows significant movement in daily transactions, hinting that large players are up to something behind the scenes.
- Invalidation of the uptrend is a daily closing candle below $23,149.
Bitcoin price shows conerning signals behind the scenes. Technichal and On-chain analysis is utilized to gage market behaviour.
Bitcoin price is at a fork in the road
Bitcoin price has shown an applaudable price performance in the last few weeks. The peer-to-peer digital currency has propelled towards a weekly high at $ 24,921 since witnessing a low at 17,592 just two months earlier in July. Despite the 40% rally, the trajectory has not been a smooth sailing ship. Several technical indicators and onchain analysis tools confound the idea of a weakening trend.
Bitcoin price currently auctions at $24,238. A profit-taking consolidation unfolds near last week’s forecasted target of $24,600. The Relative Strength Index shows classic bearish divergence, while the volume profile indicator shows a lack of interest from large capital players.
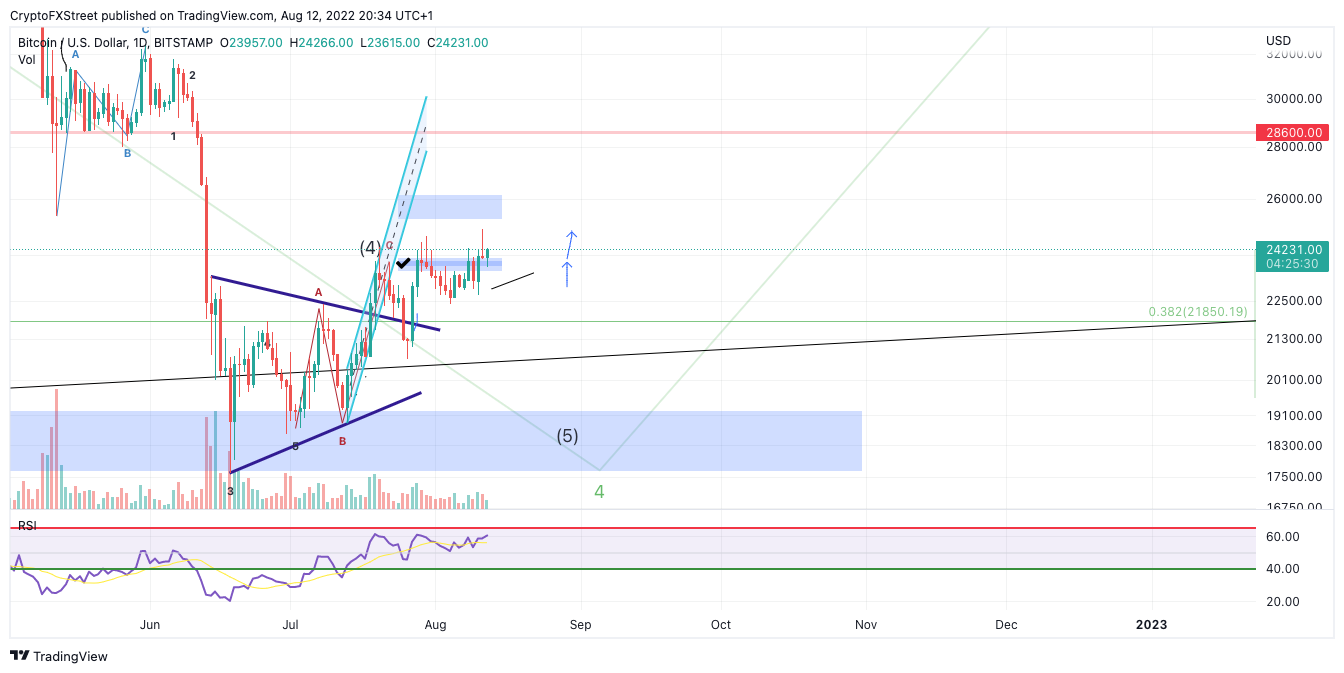
BTC/USDT 1-Day Chart
Additionally, Santiment’s Active Transactions Indicator BTC price has shown a considerable uptick in daily transactions. On May 4, May 14, and June 24, the indicator showed a similar sporadic upswing, each time followed by a minimum 20% plummet in the Bitcoin price shortly after.
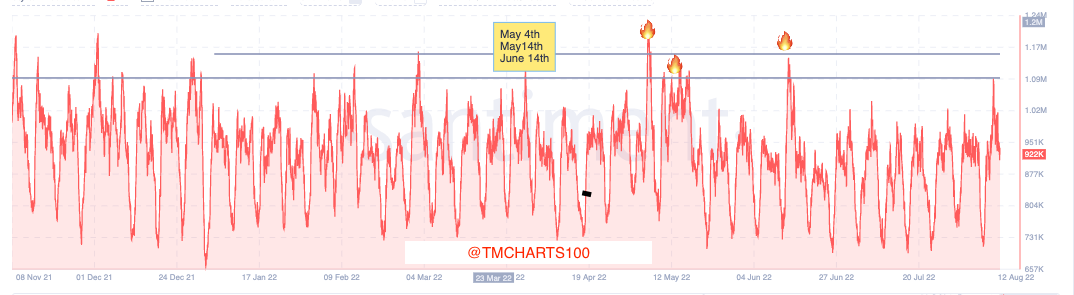
Santiment Active Transactions 1-Hour Scale
Bitcoin price could still rally higher towards $26,800, but early evidence of the downtrend scenario will be a daily close below $23,149. If the bears can produce said price action, they may be able to induce a sellers’ frenzy targeting $18,500, resulting in up to a 20% decline from the current Bitcoin price.
In the following video, our analysts deep dive into the price action of Bitcoin, analyzing key levels of interest in the market. -FXStreet Team
Information on these pages contains forward-looking statements that involve risks and uncertainties. Markets and instruments profiled on this page are for informational purposes only and should not in any way come across as a recommendation to buy or sell in these assets. You should do your own thorough research before making any investment decisions. FXStreet does not in any way guarantee that this information is free from mistakes, errors, or material misstatements. It also does not guarantee that this information is of a timely nature. Investing in Open Markets involves a great deal of risk, including the loss of all or a portion of your investment, as well as emotional distress. All risks, losses and costs associated with investing, including total loss of principal, are your responsibility. The views and opinions expressed in this article are those of the authors and do not necessarily reflect the official policy or position of FXStreet nor its advertisers. The author will not be held responsible for information that is found at the end of links posted on this page.
If not otherwise explicitly mentioned in the body of the article, at the time of writing, the author has no position in any stock mentioned in this article and no business relationship with any company mentioned. The author has not received compensation for writing this article, other than from FXStreet.
FXStreet and the author do not provide personalized recommendations. The author makes no representations as to the accuracy, completeness, or suitability of this information. FXStreet and the author will not be liable for any errors, omissions or any losses, injuries or damages arising from this information and its display or use. Errors and omissions excepted.
The author and FXStreet are not registered investment advisors and nothing in this article is intended to be investment advice.
Recommended Content
Editors’ Picks
Ripple's move above this key level could trigger nearly 50% rally for XRP
Ripple has overcome a critical resistance level and flipped into a support floor on the weekly time frame. This development happened while XRP tightly consolidated for roughly 250 days. Investors can expect XRP to kickstart a massive rally.
Optimism price outlook with nearly $90 million worth of OP tokens flooding markets on Friday
Optimism volatility has shrunk in the ours leading to the network’s cliff unlock. It joins the likes of dYdX and Sui, which have similar events on their calendars. As token unlocks are often considered bearish catalysts, investors should brace for a reaction after the event.
Top 3 Price Prediction Bitcoin, Ethereum, Ripple: Retail watches from the sidelines with a bias for shorts
Bitcoin could clear $73,777 peak as BTC bulls resurface. Ethereum might fall 10% before next leg up as ETH RSI teases with sell signal. XRP could lose $0.6000 threshold as Ripple bulls fail to show up.
Jito price could hit $6 as JTO coils up inside this bullish pattern
Jito price action shows a potential cup and handle formation. Based on theoretical measurement rules, a successful breakout could yield a 56% rally to $6.0. A breakdown of the $3.86 support level would create a lower low for JTO and invalidate the bullish thesis.
Bitcoin: BTC may have recovered, but is it out of the woods?
Bitcoin’s (BTC) upward momentum has shown a significant decline for the past two weeks or so. This development led to a bearish signal on the weekly and an uncertain outlook on the monthly.