Bitcoin price prediction: BTC/USD still in range trading
- Despite the pessimistic atmosphere surrounding the markets, Bitcoin still hasn't gone nowhere and is still trading inside a range gravitating around the $8400 mark
- The position of moving averages complicates the bullish outlook and will require some days to increase bullish cross chances

Following the tone of the last sessions, European session awakens with red numbers across the Crypto board. The market mood is hinting some pessimism, but let's see what the technicals tell us.
BTC/USD 4H chart
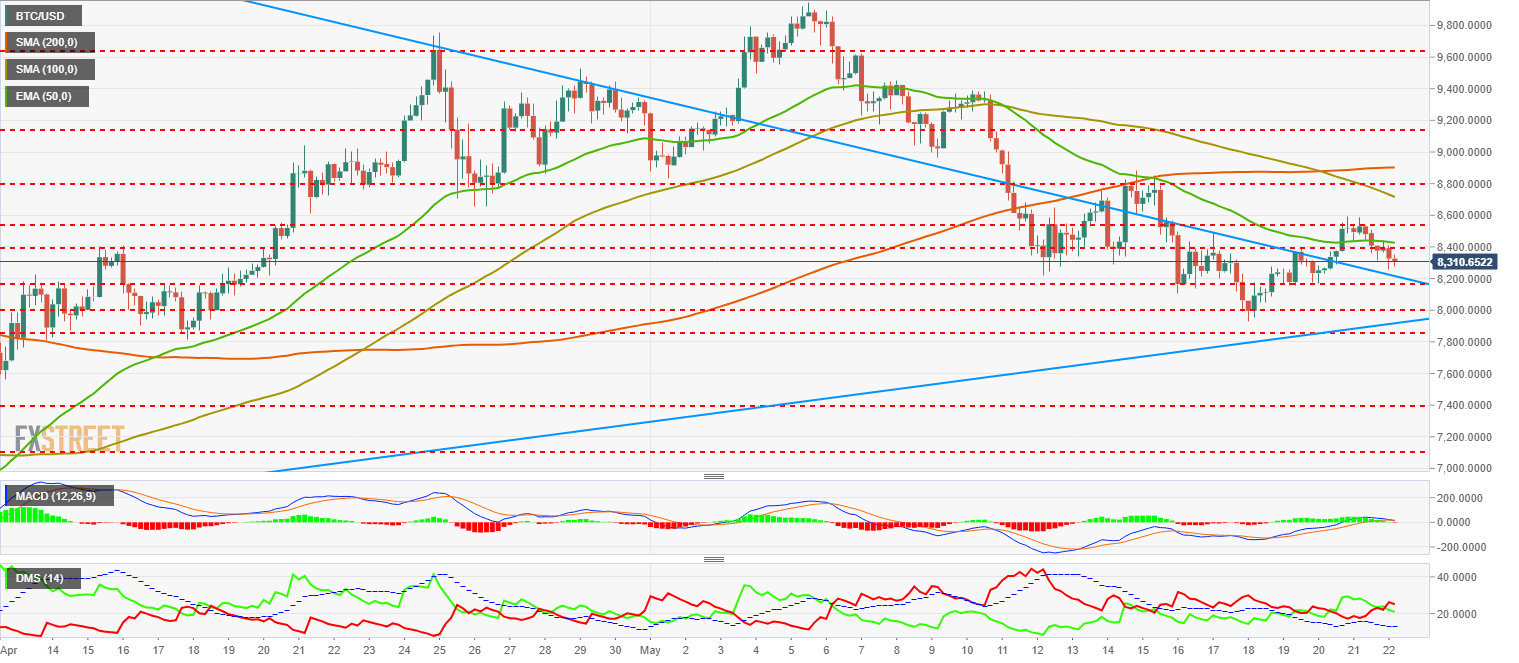
Bitcoin is trading above the trendline from the Diamond formation that has contained its movement during the last weeks. The presence of three important moving averages just above where it is located sets an important challenge for any bullish attempts, allowing a certain margin in the bearish side that might cover some ground without breaking the current technical outlook. The 50-EMA is the closest one, halting the bullish leg from the recent hours. On the upside, the 100-SMA has crossed to the downside the 200-SMA, which still slightly maintains its bullish profile.
On the upside, the first complex area to beat in the confluence is located between a price resistance at $8386 and the mentioned 50-EMA, trading at $8427. Above there, we would quickly find the following price resistance at $8538, followed by the 100-SMA at the $8715 mark. Breaking above the $8905 where the 200-SMA is located would be great news for the bulls, carrying then enough momentum to enter a scenario favorable for the rises.
Our Technical Confluence Indicator can really help us to follow these levels:
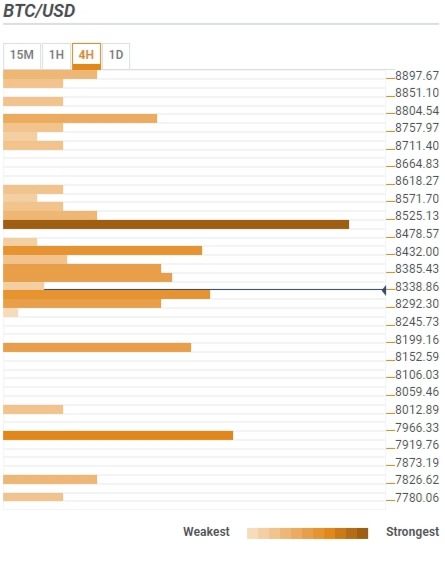
Below the current price, an important support is located at $8172, where a trendline and a price congestion support meet. Below there, the area between the $8000 levels and the $7585 represents the last line separating the current lateral action from a seriously bearish scenario in the mid-term.
MACD in the Bitcoin 4-hour chart is slightly crossed to the downside, but still above the 0 line. This backs a slightly bearish lateral movement for the upcoming periods. A slide above the superior side of the Diamond formation is still the most probable scenario.
Directional Movement Index in the same chart shows a slight advantage to the sellers, that have been increasing their positioning in the last periods, but still haven't been able to drag the ADX, which is still trading in the lows.
Author

Tomas Salles
FXStreet
Tomàs Sallés was born in Barcelona in 1972, he is a certified technical analyst after having completing specialized courses in Spain and Switzerland. He expanded his technical training following the guidance of great experts on the financial markets.



