Bitcoin Price Prediction: BTC/USD persistence could yield into rally to $11,000 – Confluence Detector
- Bitcoin price recovers slightly from the dip to $9,000 but must brace for the confluence resistance at $9,455.
- BTC/USD has the potential to hit highs above $10,000 and $11,000 as long as the hurdle at $9,651 is broken.

Bitcoin price tanked to $9,000 this week from highs close to $10,000. Support at $9,000 came in handy in stopping losses back into the $8,000 range. Recovery from the weekly low remains slow but steady. BTC/USD is trading marginally above $9,400. The immediate downside is supported by the 50-day SMA. Moreover, trendline support is still intact.
Consolidation is expected to take precedence throughout the weekend session as seen with the sidelong moving RSI. Besides, bearish pressure cannot be ignored, especially with the MACD featuring a slightly bearish divergence. Gains above $9,500 are needed to keep the focus at $10,000. Bitcoin has traded highs above $10,500 this year and still has the potential to hit levels above $11,000. At the moment, the market is in a range (a wide range between $9,000 and $10,000).
BTC/USD daily chart
-637276268494868311.png)
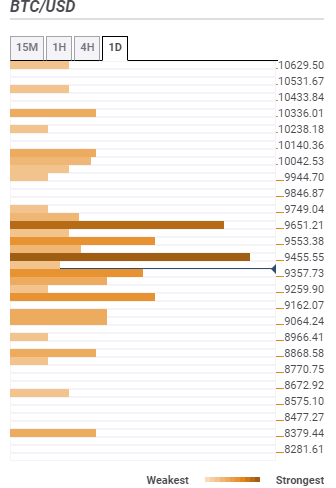
Bitcoin confluence resistance and support levels
Bitcoin price recovery further above $9,400 depends on the buyers’ ability to clear the first confluence resistance at $9,455. This region hosts various technical levels including the previous low 4-hour, SMA 200 4-hour, the Bollinger Band 15-minutes upper curve, the Fibonacci 38.2% one-week and the SMA 50 15-minutes.
Another hurdle holds the ground at $9,651 and will give bulls a hard time in the battle to reach $10,000. The area highlights several indicators including the Bollinger Band 4-hour middle, the Fibonacci 23.6% one-month, SMA 100 1-hour and the Fibo 61.8% one-week. The good news is that gains above this would remain relatively uninterrupt heading to $10,000 and $11,000.
On the downside, the daily confluence detector shows that support areas are not in plenty. Nevertheless, buyers can seek refuge at $9,357 (initial support) in the event of a reversal. The zone is home to the Bollinger Band 15-minutes lower curve, the previous low 1-hour, previous low 15-minutes and the previous high 15-minutues. The other key support areas above $9,000 include $9,259, $9,162 and $9,064.
Author

John Isige
FXStreet
John Isige is a seasoned cryptocurrency journalist and markets analyst committed to delivering high-quality, actionable insights tailored to traders, investors, and crypto enthusiasts. He enjoys deep dives into emerging Web3 tren


