Bitcoin Price Prediction: BTC/USD clasps to consolidation above $9,200 – Confluence Detector


  • Bitcoin price embraces consolidation between $9,200 support and the key resistance zone at $9,400.
  • BTC/USD is still in grave danger of falling back to $9,000 especially if the short term trendline caves in.

Bitcoin lethargic trading has been very dominant since the week started. Following recovery from the drop to $8,726 in the last week of June, BTC/USD has not been able to trade above $9,400. Besides, sustaining the price above $9,300 has been an uphill task. For instance, at the time of writing, Bitcoin is in retreat towards $9,250. If the declines continue under the short term ascending trendline, we can expect Bitcoin to spiral below $9,200 and even retest $9,000.

For now, the biggest mission for the bulls is to reclaim the position above $9,300 and sustain the gains towards $9,400. Unfortunately, bears seem to be carrying the day especially with the RSI falling towards the midline. The MACD hit a snag at 68 after recovery from -25. However, the indicator has slowed down the downtrend, holding above the mean line (0.00). Consolidation is likely to continue as long as the MACD holds in the positive zone.

BTC/USD 2-hour chart

BTC/USD price chart

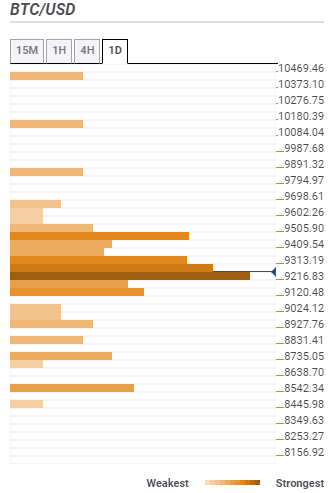
Bitcoin confluence resistance and support areas

Looking at the confluence detector tool, Bitcoin is holding above a strong support area. This means that buyers can comfortably focus on pushing the price higher. The following are some of the key resistance and support areas:

Resistance one: $9,313 – Is home to the previous high 15-minutes, the Fibo 38.2% one-day, the Bollinger Band 15-minutes middle, the SMA five 1-hour, SMA ten 15-minutes and the previous week high.

Resistance two: $9,505 – Highlighted by the pivot one-week resistance two, the Fibo 161.8% one-day and the pivot point one-day resistance two.

Support one: $9,216 – This the strongest support zone and home to the SMA 100 4-hour, the Bollinger Band 1-hour lower curve, Bollinger Band 15-mins lower, the previous low 4-hour, the Fibo 23.6% one-day, the SMA 200 15-mins and the pivot point one-week resistance one.

Support two: $9,120 – Highlighted by the Fibonacci 61.8% one-week and the pivot point one-day support two.

fxsoriginal


Information on these pages contains forward-looking statements that involve risks and uncertainties. Markets and instruments profiled on this page are for informational purposes only and should not in any way come across as a recommendation to buy or sell in these assets. You should do your own thorough research before making any investment decisions. FXStreet does not in any way guarantee that this information is free from mistakes, errors, or material misstatements. It also does not guarantee that this information is of a timely nature. Investing in Open Markets involves a great deal of risk, including the loss of all or a portion of your investment, as well as emotional distress. All risks, losses and costs associated with investing, including total loss of principal, are your responsibility. The views and opinions expressed in this article are those of the authors and do not necessarily reflect the official policy or position of FXStreet nor its advertisers. The author will not be held responsible for information that is found at the end of links posted on this page.

If not otherwise explicitly mentioned in the body of the article, at the time of writing, the author has no position in any stock mentioned in this article and no business relationship with any company mentioned. The author has not received compensation for writing this article, other than from FXStreet.

FXStreet and the author do not provide personalized recommendations. The author makes no representations as to the accuracy, completeness, or suitability of this information. FXStreet and the author will not be liable for any errors, omissions or any losses, injuries or damages arising from this information and its display or use. Errors and omissions excepted.

The author and FXStreet are not registered investment advisors and nothing in this article is intended to be investment advice.

Join Telegram

Recommended content


Recommended Content

Editors’ Picks

PancakeSwap loses nearly 3% value intraday as the DEX crosses $1 billion in trade volume

PancakeSwap loses nearly 3% value intraday as the DEX crosses $1 billion in trade volume

Decentralized exchange (DEX) PancakeSwap (CAKE) announced in an official tweet that it has crossed $1 billion in trade volume on the Layer 2 chain, Base. CAKE on-chain metrics support the thesis of a recovery in the DEX token’s price. 

More Cryptocurrencies News

Shiba Inu hits new milestone, over $9 billion worth of SHIB tokens burnt

Shiba Inu hits new milestone, over $9 billion worth of SHIB tokens burnt

Shiba Inu (SHIB), the second-largest meme coin in the crypto ecosystem, recently hit a milestone in the volume of tokens burned. Shiba Inu has burnt over 410.72 trillion SHIB tokens since the inception of the burn mechanism in the project, worth over $9 billion.

More Shiba Inu News

Dogwifhat crashes 60%, but here's why you should not buy WIF yet Premium

Dogwifhat crashes 60%, but here's why you should not buy WIF yet

Dogwifhat (WIF) price shows a slowdown in the bearish momentum as it sets up a potential range. This development could lead to a good buying opportunity from a long-term perspective. 

More Dogwifhat News

XRP struggles to overcome $0.50 resistance, SEC vs. Ripple could enter final pretrial conference

XRP struggles to overcome $0.50 resistance, SEC vs. Ripple could enter final pretrial conference

XRP is struggling with resistance at $0.50 as Ripple and the US Securities and Exchange Commission (SEC) are gearing up for the final pretrial conference on Tuesday at a New York court. 

More Ripple News

Bitcoin: BTC’s rangebound movement leaves traders confused

Bitcoin: BTC’s rangebound movement leaves traders confused

Bitcoin (BTC) price has been hovering around the $70,000 psychological level for a few weeks, resulting in a rangebound movement. This development could lead to a massive liquidation on either side before a directional move is established. 

Read full analysis

BTC

ETH

XRP