- Bitcoin hits a critical barrier at $11,800 delaying the push for gains above $12,000.
- BTC/USD embraces confluence support at $11,698 signaling a possible consolidation.
Bitcoin recovered significantly over on Thursday after resting the support at $11,100 levels earlier in the week. Initially, there was a struggle in the range between $11,500 and $11,600. However, buyers eventually gathered the strength to push for gains towards $12,000. Although all the attention effort was channeled towards breaking the resistance at $12,000, Bitcoin hit a barrier at $11,800.
Meanwhile, BTC/USD is exchanging hands at $11,768 in the wake of a minor retreat. The bearish leg has traded intraday lows of $11,686. The push for gains above $12,000 may have taken a hit but make no mistake, the bulls are unrelenting in this mission.
Moreover, the technical picture has remained positive in spite of the barrier at $11,800 and the retreat. The RSI, for instance, is clinging tightly to the level at 70 after a rigorous recovery from 60 (August low). A glance at the MACD clearly shows that consolidation would take place ahead of the expected breakout above the psychological $12,000 resistance.
If we take a wider look at the BTC/USD daily chart, then the price has been in consolidation between $11,000 (main support) and $12,000 (resistance). For now, bringing down the selling pressure is top on the bulls’ priority list.
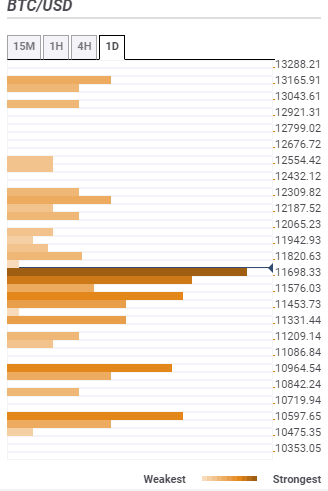
BTC/USD daily chart
Bitcoin confluence resistance and support levels
Resistance one: $11,820 – This the first resistance according to the confluence tool. It is highlighted by the previous high 1-hour, previous high 15-minutes, the Bollinger Band 15-minutes middle and the previous high one-day.
Resistance two: $11,942 – A minor seller congestion likely to delay price action to $12,000. It is highlighted by the Bollinger Band 4-upper curve.
Resistance three: $12,065 – This is the first hurdle buyers would encounter in the run above $12,000. It is home to the pivot point one-day resistance one.
Support one: $11,698 – The strongest buyer congestion zone highlighted by the SMA 100 1-hour, SMA 50 15-minutes, the Fibonacci 23.6% one-day, the previous low 1-hour and the previous low 4-hour.
Support two: $11,576 – The second most significant support zone and home to the Fibonacci 61.8% own-week, the SMA 200 15-minutes and the SMA 50 1-hour.
Support three: $11,331 – Home to the previous low one-day, the Bollinger Band 4-hour and the Bollinger Band one-day middle.
Information on these pages contains forward-looking statements that involve risks and uncertainties. Markets and instruments profiled on this page are for informational purposes only and should not in any way come across as a recommendation to buy or sell in these assets. You should do your own thorough research before making any investment decisions. FXStreet does not in any way guarantee that this information is free from mistakes, errors, or material misstatements. It also does not guarantee that this information is of a timely nature. Investing in Open Markets involves a great deal of risk, including the loss of all or a portion of your investment, as well as emotional distress. All risks, losses and costs associated with investing, including total loss of principal, are your responsibility. The views and opinions expressed in this article are those of the authors and do not necessarily reflect the official policy or position of FXStreet nor its advertisers. The author will not be held responsible for information that is found at the end of links posted on this page.
If not otherwise explicitly mentioned in the body of the article, at the time of writing, the author has no position in any stock mentioned in this article and no business relationship with any company mentioned. The author has not received compensation for writing this article, other than from FXStreet.
FXStreet and the author do not provide personalized recommendations. The author makes no representations as to the accuracy, completeness, or suitability of this information. FXStreet and the author will not be liable for any errors, omissions or any losses, injuries or damages arising from this information and its display or use. Errors and omissions excepted.
The author and FXStreet are not registered investment advisors and nothing in this article is intended to be investment advice.
Recommended Content
Editors’ Picks
Ripple's move above this key level could trigger nearly 50% rally for XRP
Ripple has overcome a critical resistance level and flipped into a support floor on the weekly time frame. This development happened while XRP tightly consolidated for roughly 250 days. Investors can expect XRP to kickstart a massive rally.
Optimism price outlook with nearly $90 million worth of OP tokens flooding markets on Friday
Optimism volatility has shrunk in the ours leading to the network’s cliff unlock. It joins the likes of dYdX and Sui, which have similar events on their calendars. As token unlocks are often considered bearish catalysts, investors should brace for a reaction after the event.
Top 3 Price Prediction Bitcoin, Ethereum, Ripple: Retail watches from the sidelines with a bias for shorts
Bitcoin could clear $73,777 peak as BTC bulls resurface. Ethereum might fall 10% before next leg up as ETH RSI teases with sell signal. XRP could lose $0.6000 threshold as Ripple bulls fail to show up.
Jito price could hit $6 as JTO coils up inside this bullish pattern
Jito price action shows a potential cup and handle formation. Based on theoretical measurement rules, a successful breakout could yield a 56% rally to $6.0. A breakdown of the $3.86 support level would create a lower low for JTO and invalidate the bullish thesis.
Bitcoin: BTC may have recovered, but is it out of the woods?
Bitcoin’s (BTC) upward momentum has shown a significant decline for the past two weeks or so. This development led to a bearish signal on the weekly and an uncertain outlook on the monthly.