Bitcoin Price Prediction: BTC poised for new all-time highs as technicals reveal 17% breakout in sight
- Bitcoin price is bounded inside an ascending triangle pattern on the 4-hour chart.
- The digital asset will climb to new all-time highs if it can conquer key resistance level.
- Most indicators show that bulls have the upper hand.

Bitcoin price had a major recovery move from a local bottom of $43,000 established on February 28. The flagship cryptocurrency is now on its way to new all-time highs as long as it can climb above a key resistance level.
Bitcoin price is on the verge of rising to $60,000
On the 4-hour chart, Bitcoin has established an ascending triangle pattern with a resistance trendline formed at $51,700. A breakout above this point will quickly drive Bitcoin price towards $60,000.
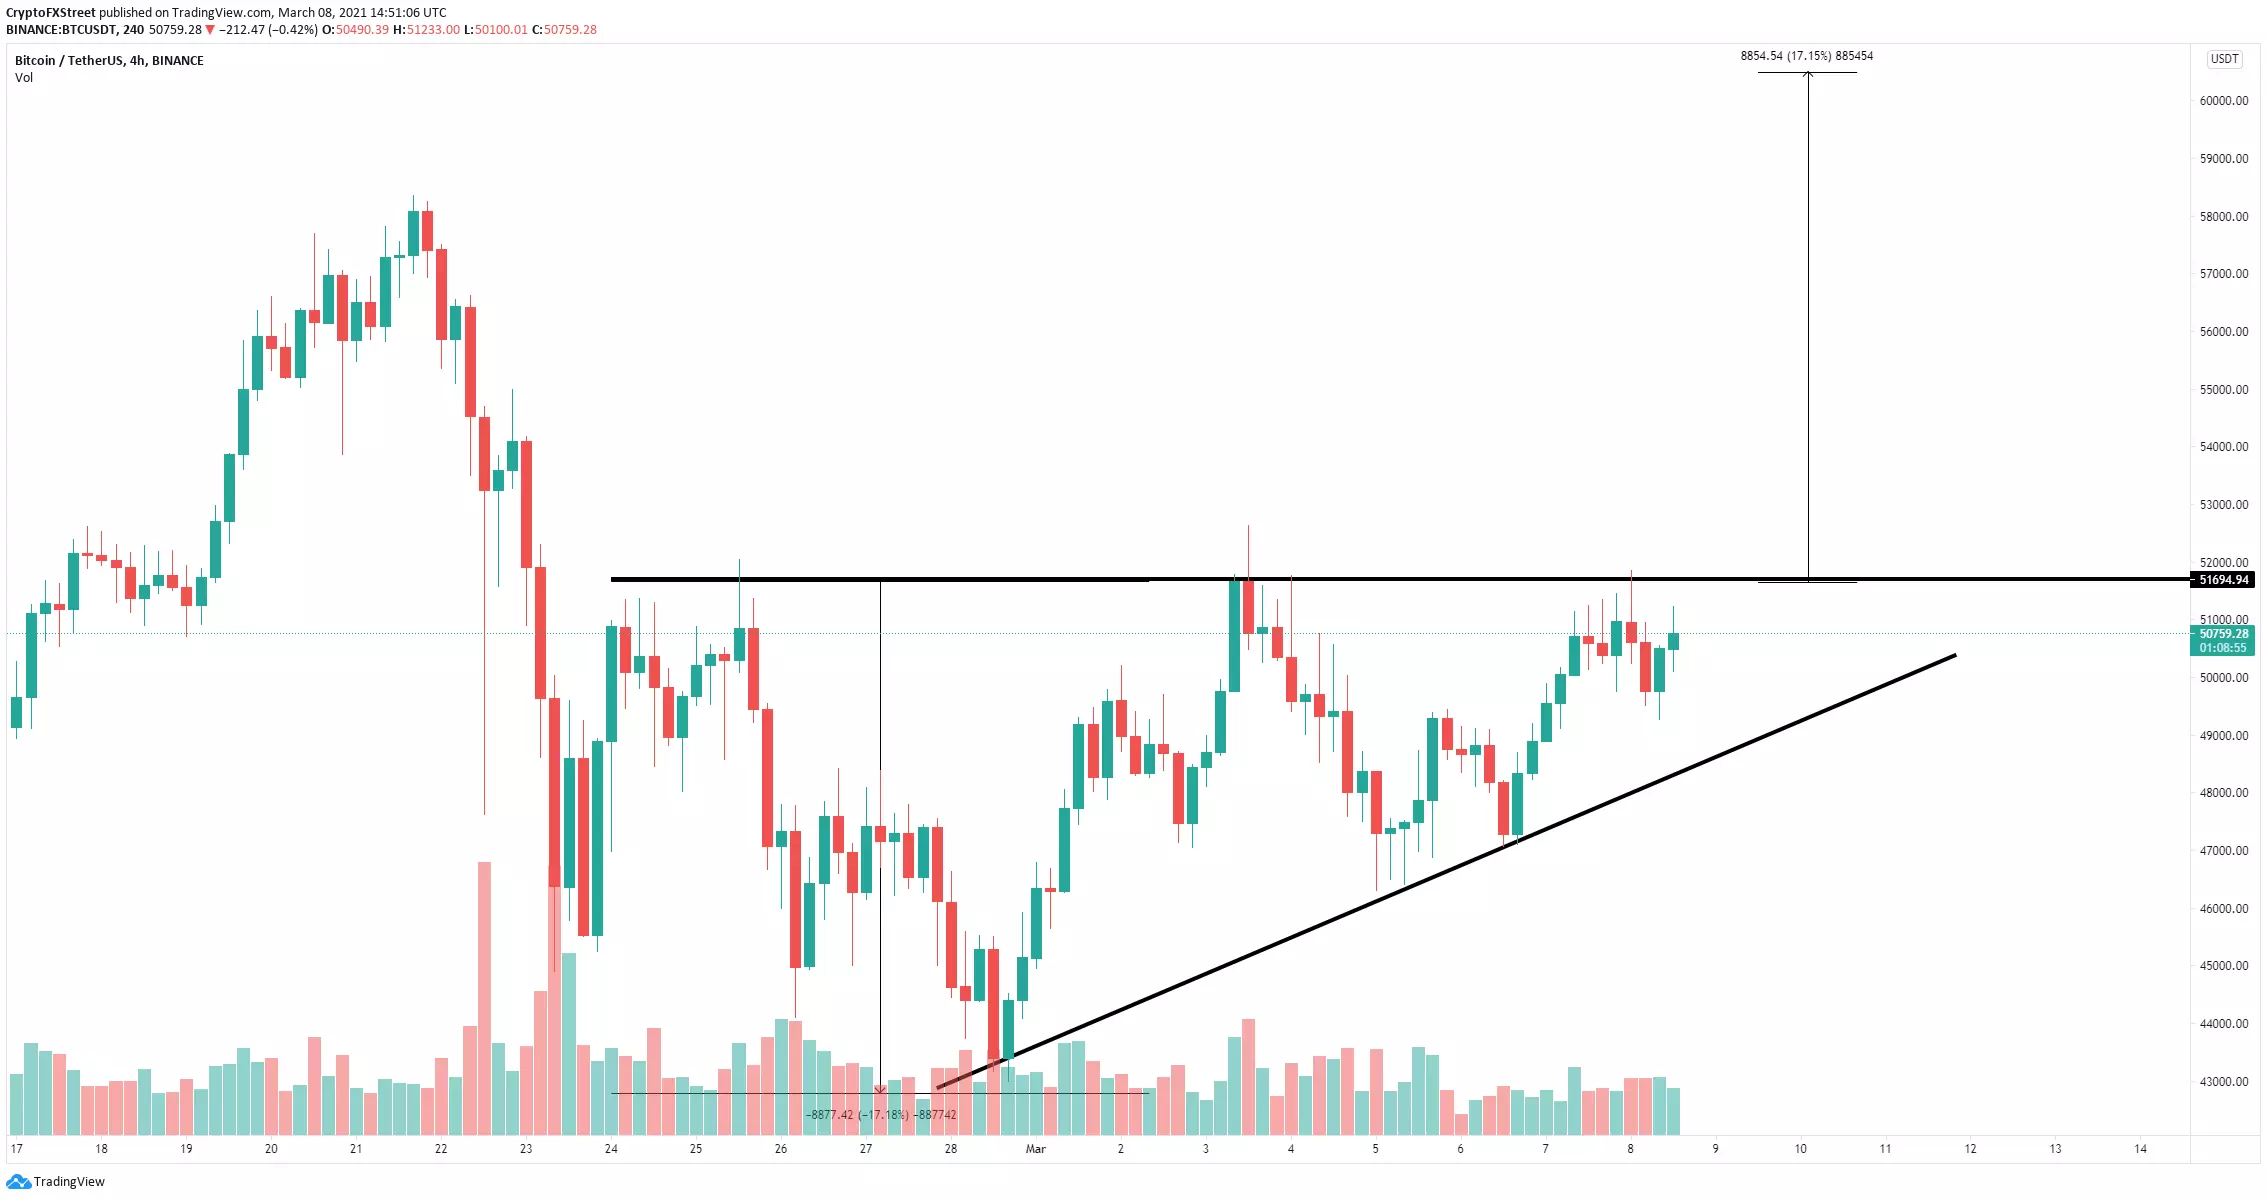
BTC/USD 4-hour chart
The In/Out of the Money Around Price (IOMAP) chart shows weak resistance above $52,000. The strongest barrier is located between $53,300 and $54,500 with 122,460 BTC in volume. On the other hand, Bitcoin bulls count with a lot of support below $50,000 until $46,500.
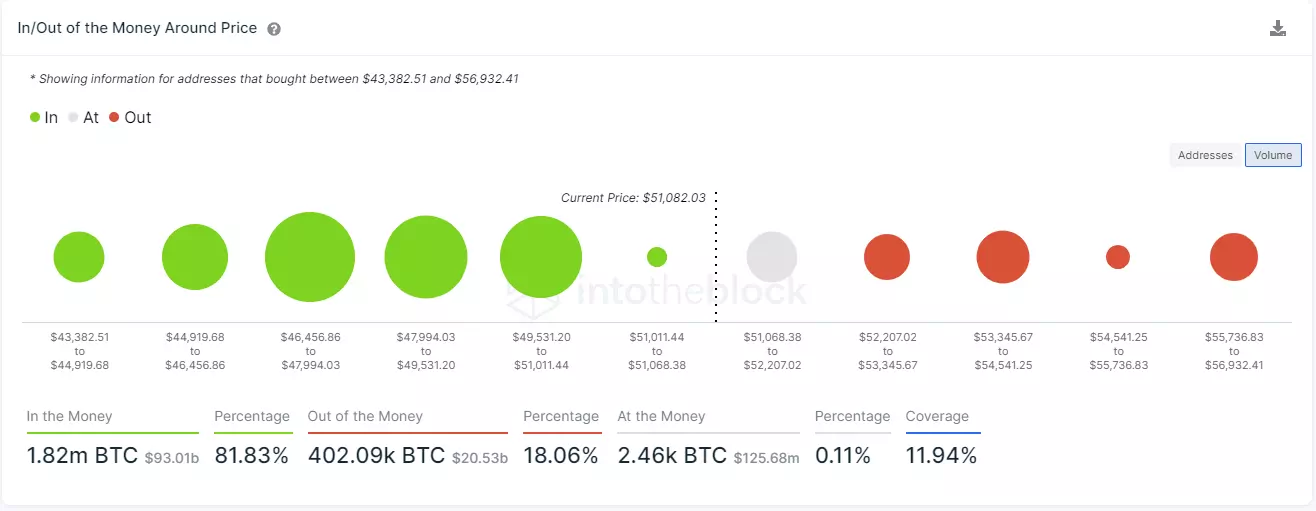
BTC IOMAP chart
Additionally, the MVRV(30d) of Bitcoin remains low, almost into the buy zone, which indicates that a 17% breakout should not be hard for the bulls as the danger zone is above 20%, and the MVRV is currently at 4% only.
%20[16.03.21,%2008%20Mar,%202021]-637508127670505631.png)
BTC MVRV (30d) chart
However, on the 9-hour chart, the TD Sequential indicator has just presented a sell signal at the top of the ascending triangle pattern, which could lead to a significant rejection.
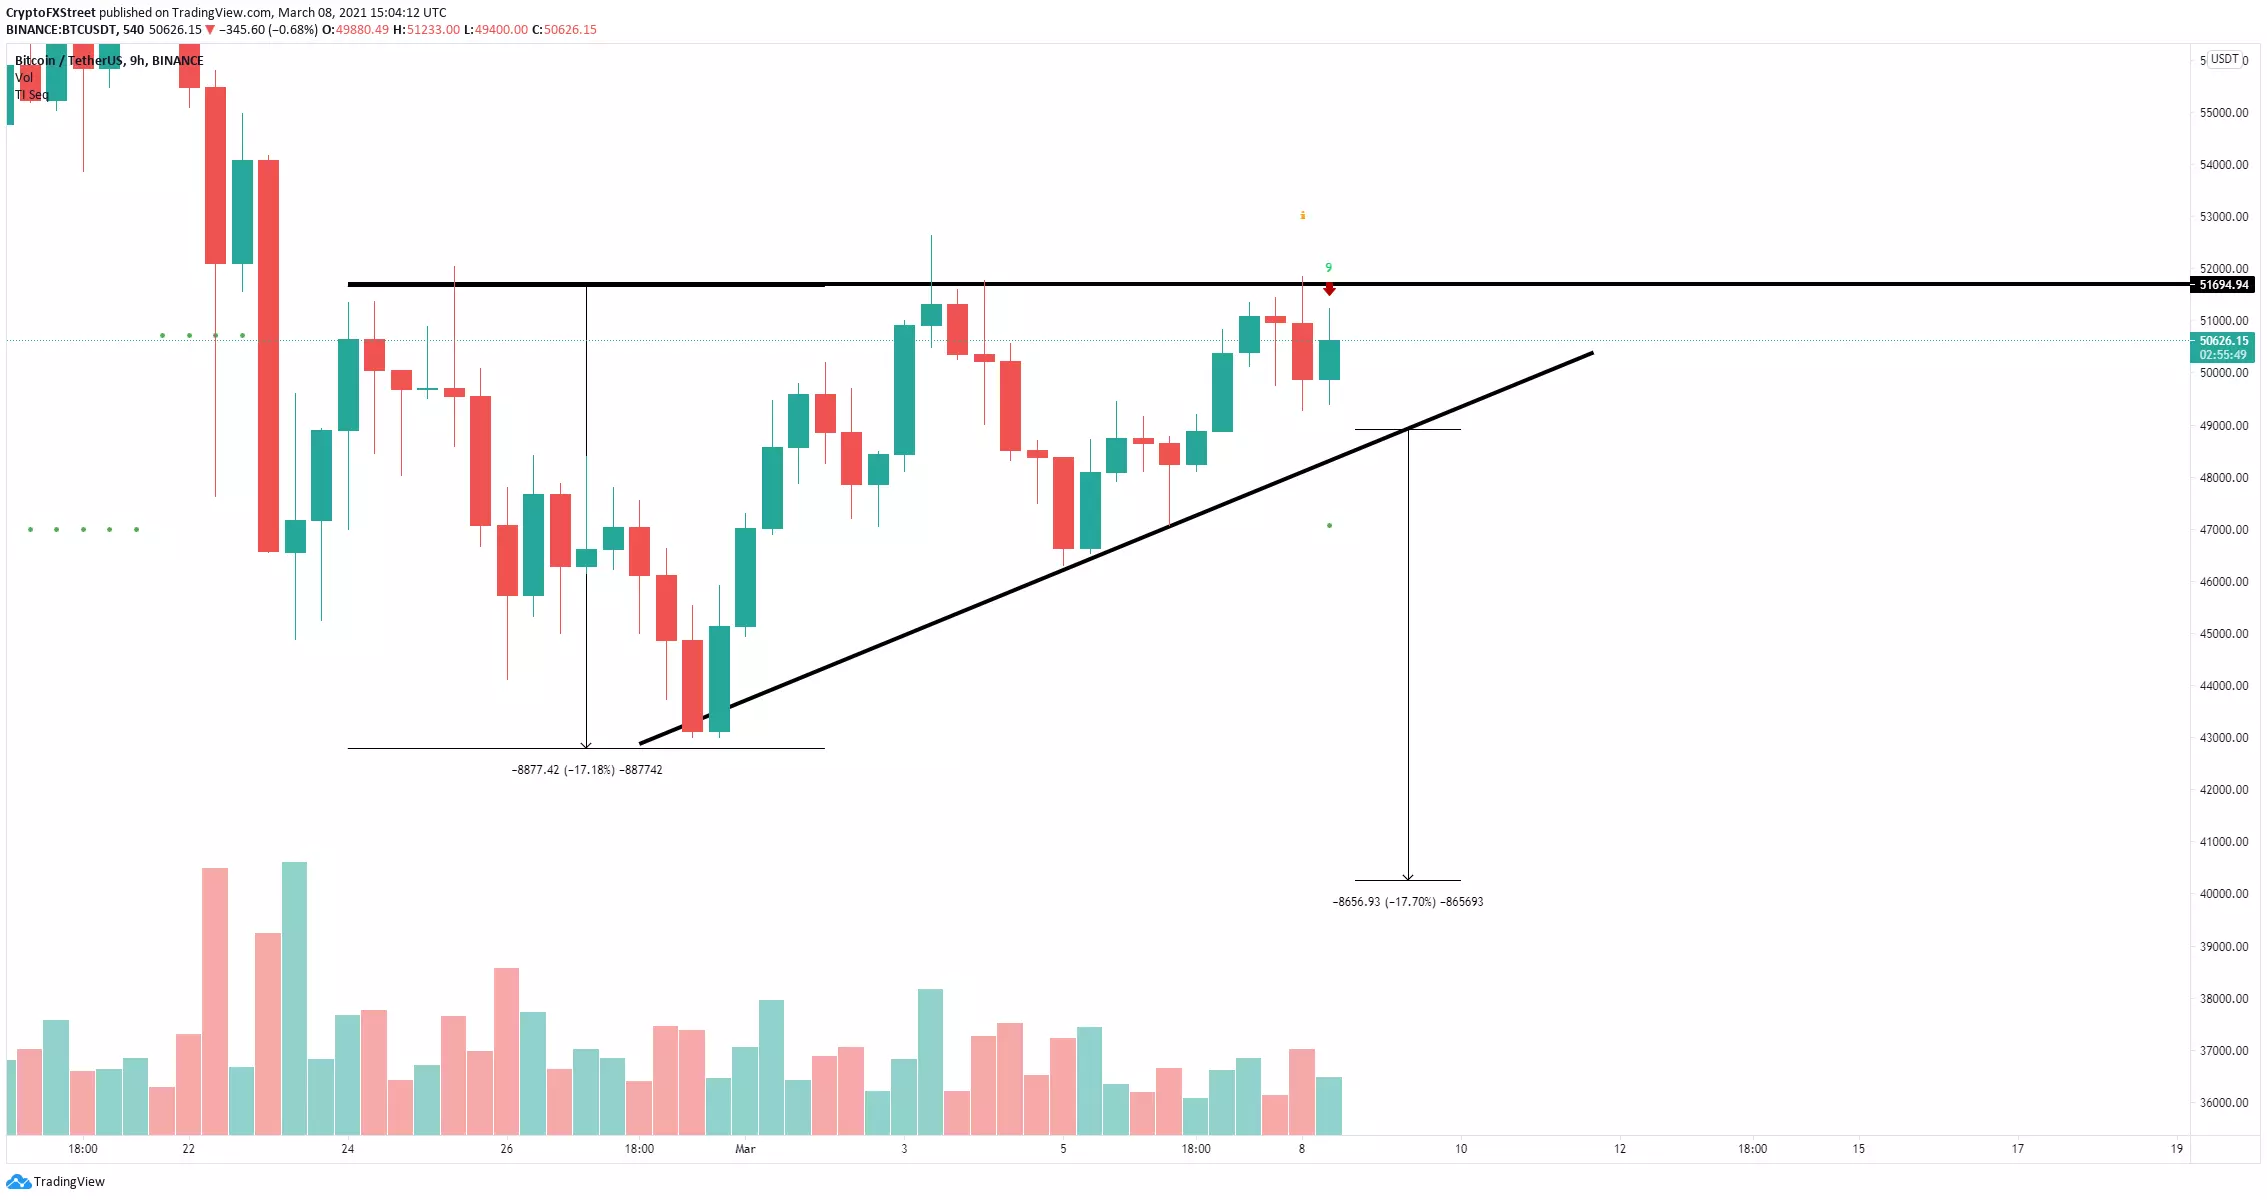
BTC/USD 9-hour chart
Bitcoin price must stay above $48,800 to avoid a massive 17% breakdown towards $40,000, calculated using the height of the ascending triangle pattern as a reference point.
Author

Lorenzo Stroe
Independent Analyst
Lorenzo is an experienced Technical Analyst and Content Writer who has been working in the cryptocurrency industry since 2012. He also has a passion for trading.


