Bitcoin completes decline after lower low and strong push up
-
Bitcoin (BTC/USD) made a new lower low as expected in our previous wave analysis. The strong bullish bounce could indicate the temporary end of the bearish pullback.
-
Price action is facing a key resistance trend line (orange) after a strong bullish impulse up. Considering the recent price action, the bulls seems to be back in control.
-
At resistance, price action could make a pullback (orange arrows) but a bullish continuation is expected (blue arrows).

This article reviews how the uptrend might take shape in the next upcoming week.
Price charts and technical analysis
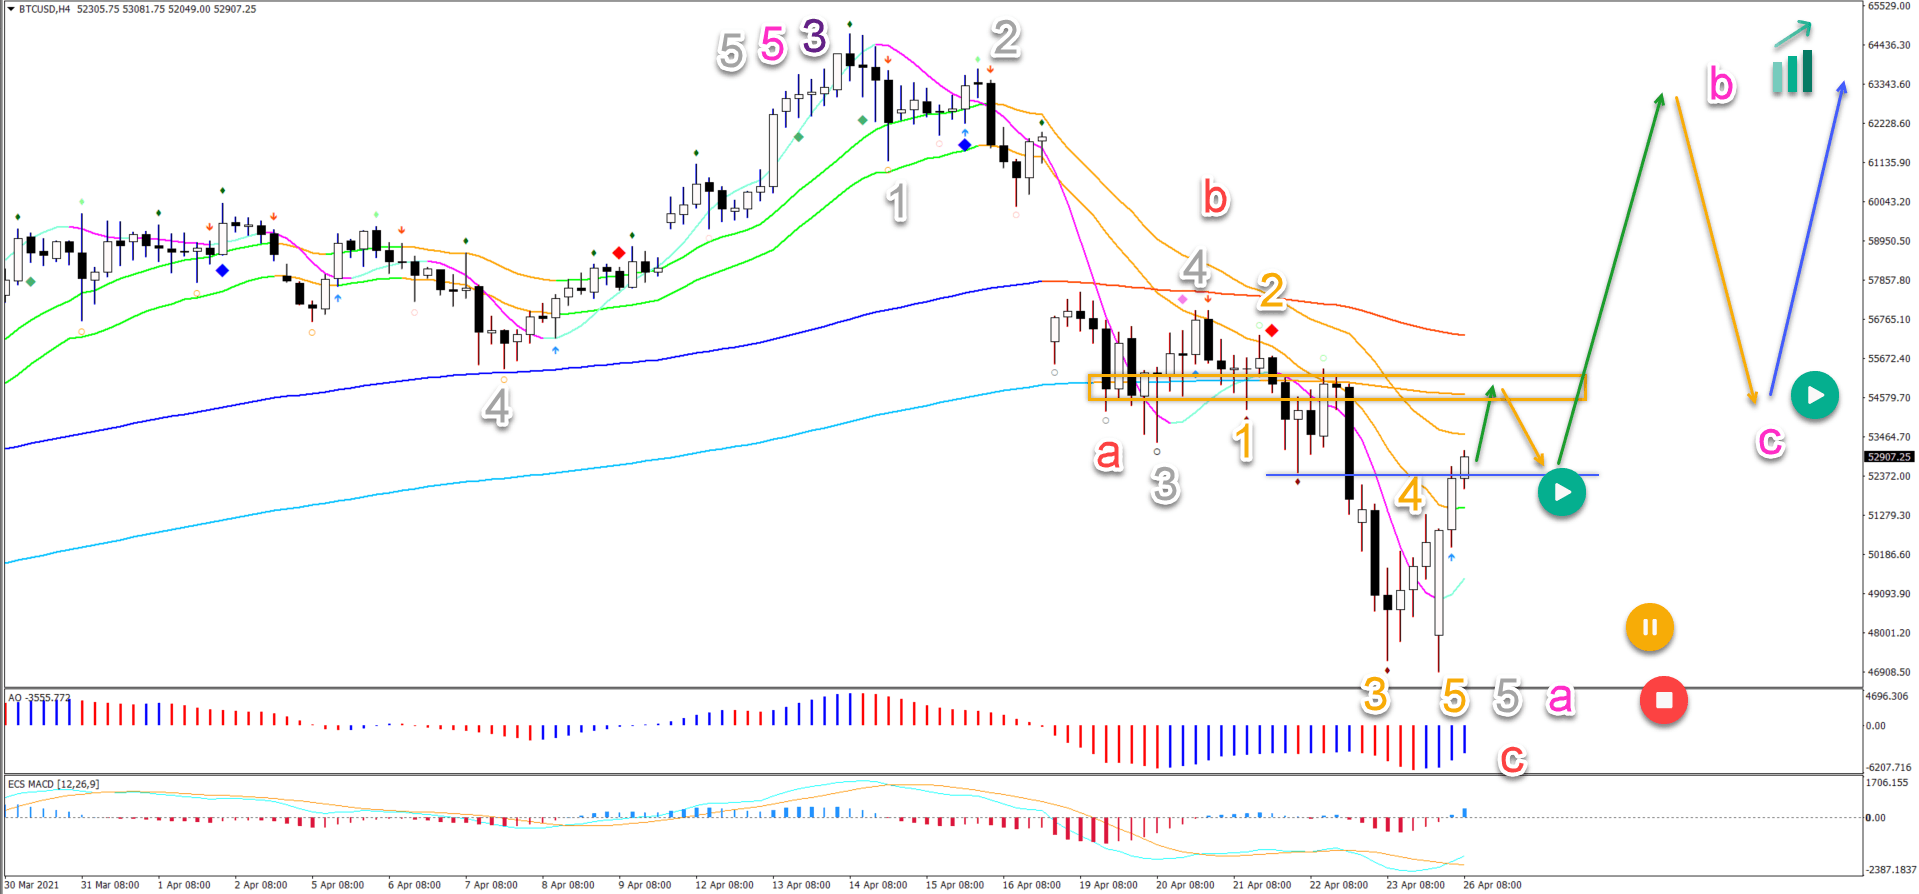
The BTC/USD chart is showing a complete 5 bearish waves down (orange) in wave 5 (grey) of wave A (pink). The alternative is an ABC (red) pattern down:
-
A bullish ABC up could indicate a wave B (pink). In that case, another price swing down could be a wave C (pink).
-
Considering the strength of the uptrend on the higher time frames, the pullback in wave C could be shallow.
-
A 5 wave pattern (rather than an ABC) could indicate a wave 1 and wave 2 rather than B and C. This scenario is also bullish.
-
An immediate push up (green arrow) is likely to test the resistance zone (orange box).
-
A bearish bounce could decline to test the support (blue box) and inverted head and shoulders level.
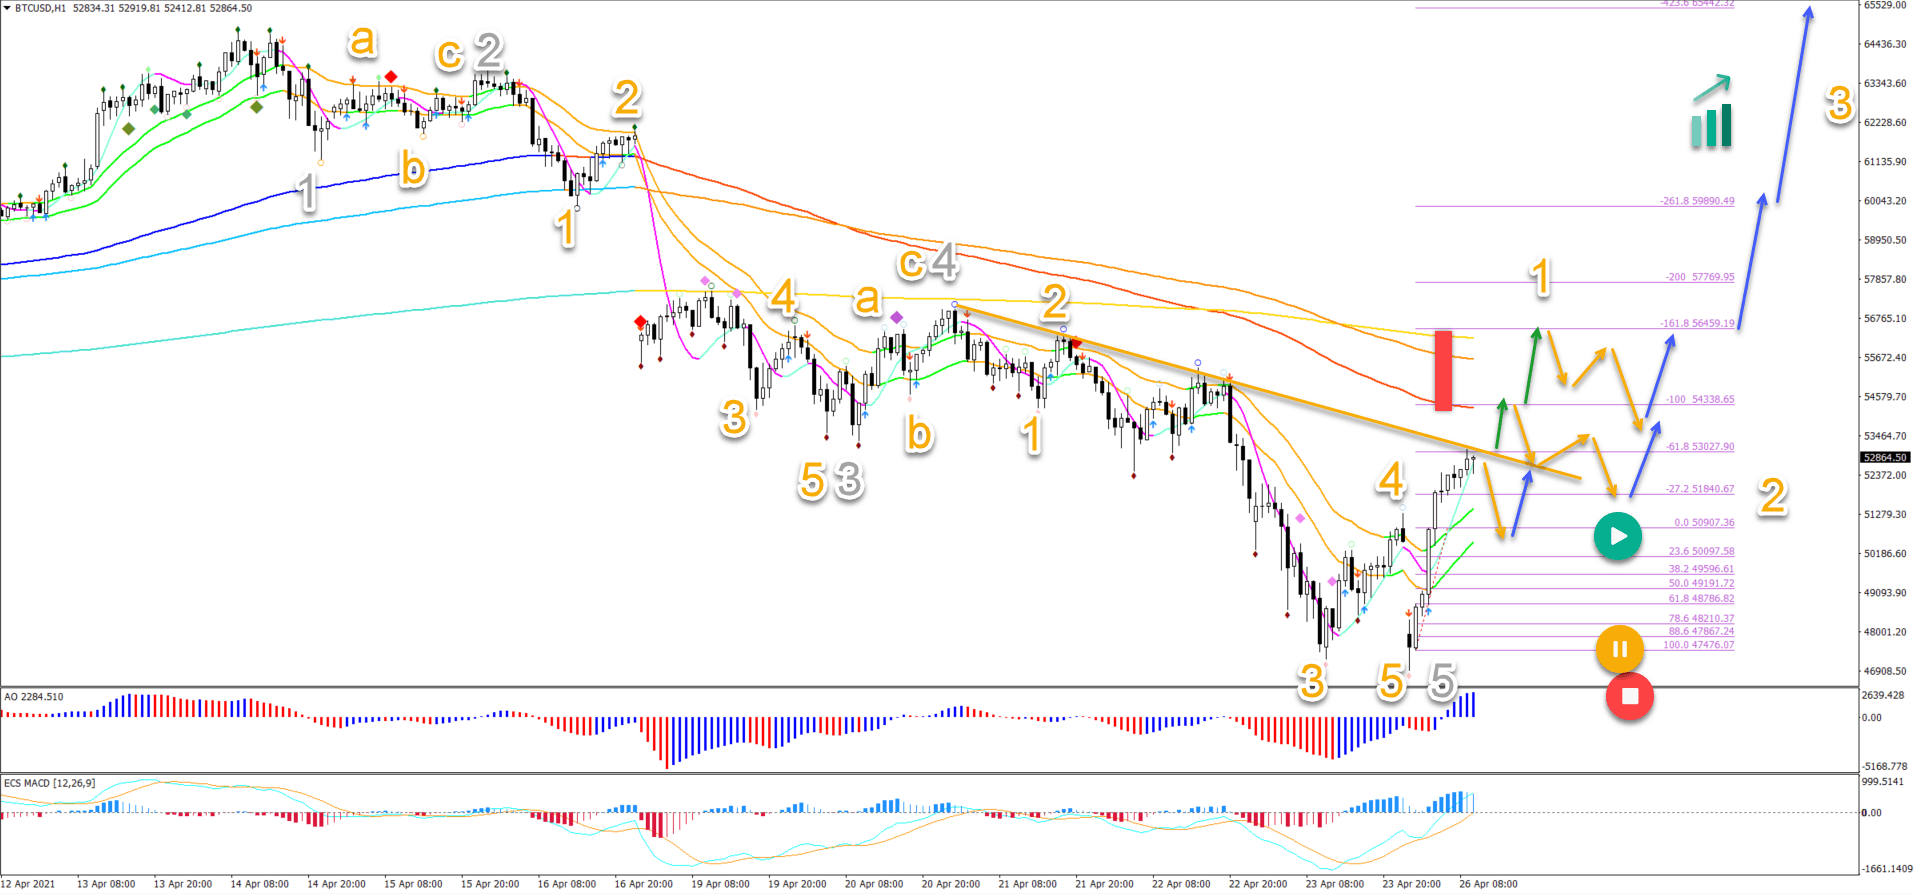
On the 1 hour chart, price action is facing a key resistance trend line (orange) after a strong bullish impulse up. Considering the recent price action, the bulls seems to be back in control:
-
The bearish wave 5 seems completed.
-
The bullish price action is showing larger bullish candles with closes near the high, indicating bull control.
-
Price action managed to break above and away from the 21 ema zone, which changed the angle of the 21 emas to up.
-
Either a breakout (green arrow) or a bounce up after a pullback (orange and green arrows) is likely.
-
The next target is the Fibonacci levels and resistance zone (red box).
-
At resistance, price action could make a pullback (orange arrows) but a bullish continuation is expected (blue arrows).
The analysis has been done with the ecs.SWAT method and ebook.
Author

Chris Svorcik
FS method
Chris Svorcik is a trader, analyst, and educator with over 15 years of experience in financial markets, specializing in moving averages, market structure, and price patterns.


