Bitcoin price overview: BTC/USD flirts with the 61.8% Fib level amid low trading activity
- Bitcoin price stays in the red as traders lower trading activity.
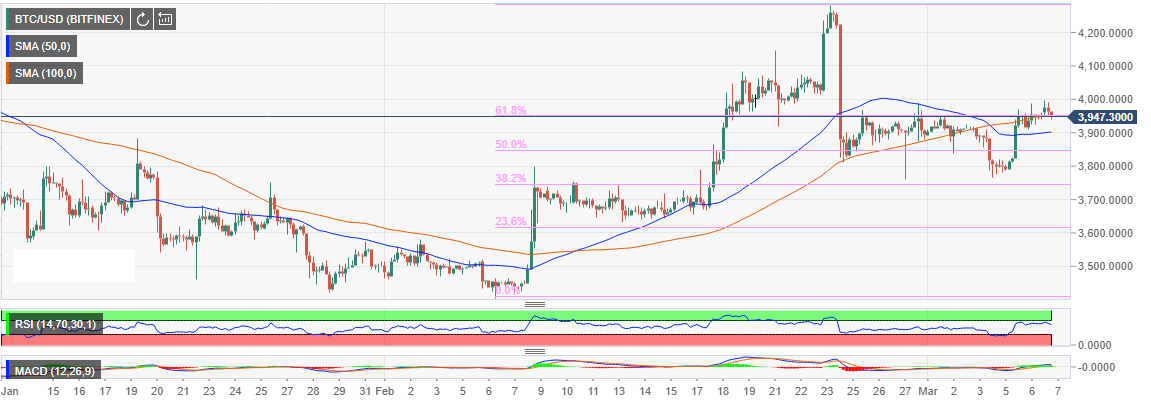
- Bitcoin price supported by the 100-SMA 4-hour chart and the 50-SMA 4-hour chart currently at $3,900.

The market is back in the red as assets embark on trimming gains following the recovery on Tuesday. February was the recovery month since 2019 started where Bitcoin rose against all odds breaching the resistance at $4,000. BTC/USD also zoomed past $4,100 before coming to a halt slightly below $4,200.
The price has since retracted below $4,000 to the extent of testing the support provided by the 38.2% Fibonacci retracement level taken between the last swing high of $4,282.40 and a swing low of $3,411.31. While there has been a correction from the recent lows, Bitcoin has not been able to break above $4,000 again.
At the time of writing, BTC/USD is flirting with the 61.8% Fib level and trading at $3,949.9 according to the prices on Bitfinex exchange. The crypto is supported by the 100-SMA 4-hour chart and the 50-SMA 4-hour chart currently at $3,900. There is a high chance that Bitcoin will retreat below $3,900 as the Relative Strength Index (RSI) changes direction to the south after failing to enter the overbought. If the support at $3,900 is cleared, expect $3,800 to come in handy while $3,700 will prevent further declines that could test $3,500.
Get 24/7 Crypto updates in our social media channels: Give us a follow at @FXSCrypto and our FXStreet Crypto Trading Telegram channel
Author

John Isige
FXStreet
John Isige is a seasoned cryptocurrency journalist and markets analyst committed to delivering high-quality, actionable insights tailored to traders, investors, and crypto enthusiasts. He enjoys deep dives into emerging Web3 tren


