Bitcoin Gold Price Analysis: BTG/USD spikes up by 13.5%
- BTG/USD went up by $14.75 to $16.75 this Friday.
- SMA 20 acts like immediate resistance.

BTG/USD bulls had a field day this Friday as they took the price up from $14.75 to $16.75. It is difficult to tell whether this is a false breakout or the market sentiment has shifted towards the bulls. On the upside, resistance levels lie at $17, $17.75, and $18.50. On the downside, there are support levels at $13.25, $14, and $14.50.
BTG/USD Daily Chart
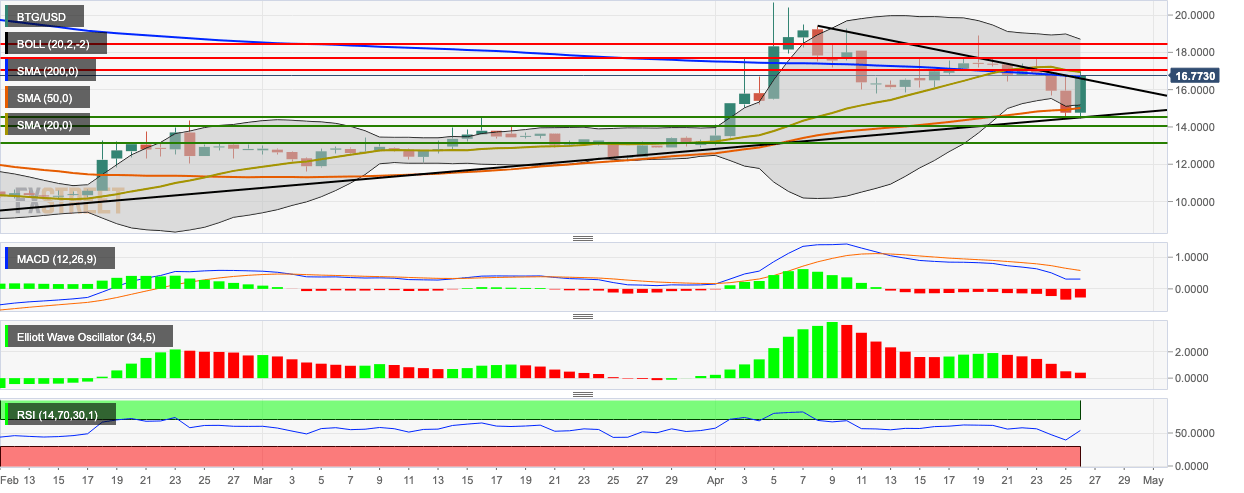
- The 20-day Bollinger band’s squeeze shows decreasing market volatility.
- The latest session brought the price back inside the Bollinger band and up to the SMA 20 curve.
- The price has also managed to pass the SMA 200 curve.
- The signal line has taken a turn to move towards the MACD line to show decreasing market momentum.
- The relative strength index (RSI) indicator has taken a sharp turn to move towards the overbought zone.
Author

Rajarshi Mitra
Independent Analyst
Rajarshi entered the blockchain space in 2016. He is a blockchain researcher who has worked for Blockgeeks and has done research work for several ICOs. He gets regularly invited to give talks on the blockchain technology and cryptocurrencies.
More from Rajarshi Mitra


