Bitcoin Cash Technical Analysis: BCH/USD toying with critical near-term support
- Bitcoin Cash nursing deep losses of around 6% well into the second half on Thursday.
- BCH/USD runs a risk of seeing the gains from recent bull run handed back.

BCH/USD 15-minute chart
- Price action moving within a descending wedge pattern formation via the 15-minute chart view.
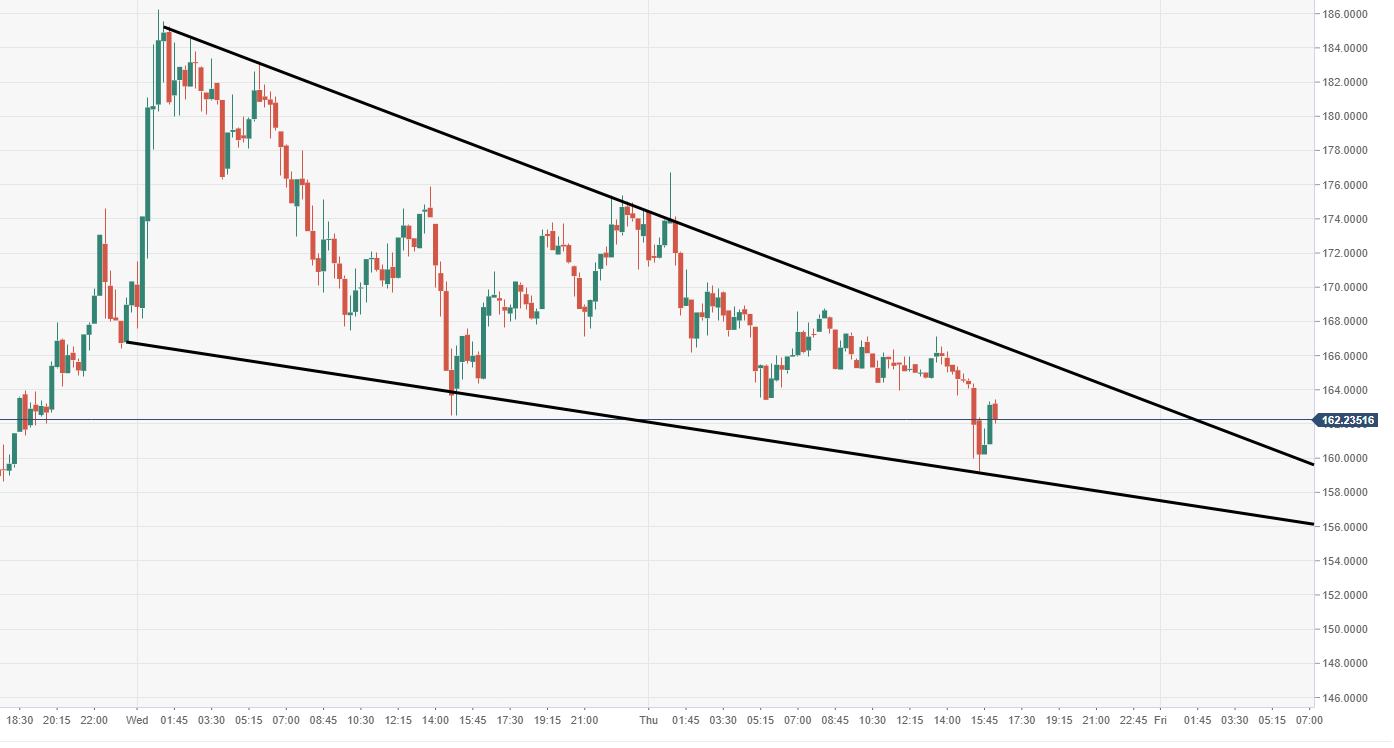
Spot rate: 162.21
Relative change: -5.66%
High: 176.73
Low: 159.21
Trend: Bearish
Support 1: 162.02, daily pivot point support.
Support 2: 150.35, daily pivot point support.
Support 3: 138.23, daily pivot point support.
Resistance 1: 185.81, daily pivot point resistance.
Resistance 2: 197.94, daily pivot point resistance.
Resistance 3: 209.60, daily pivot point resistance.
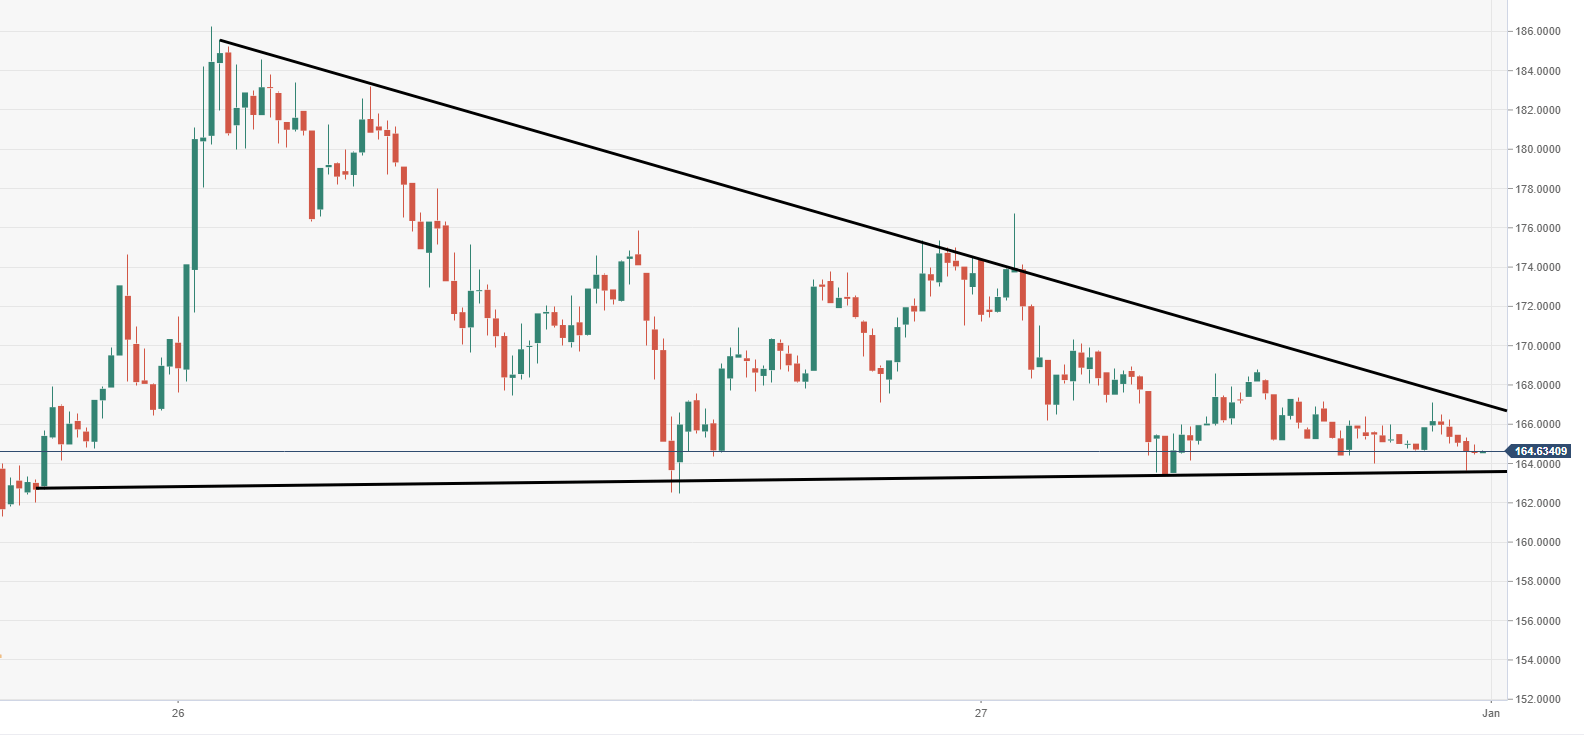
BCH/USD 60-minute chart
- BCH/USD is moving within the confinements of horizontal wedge pattern.
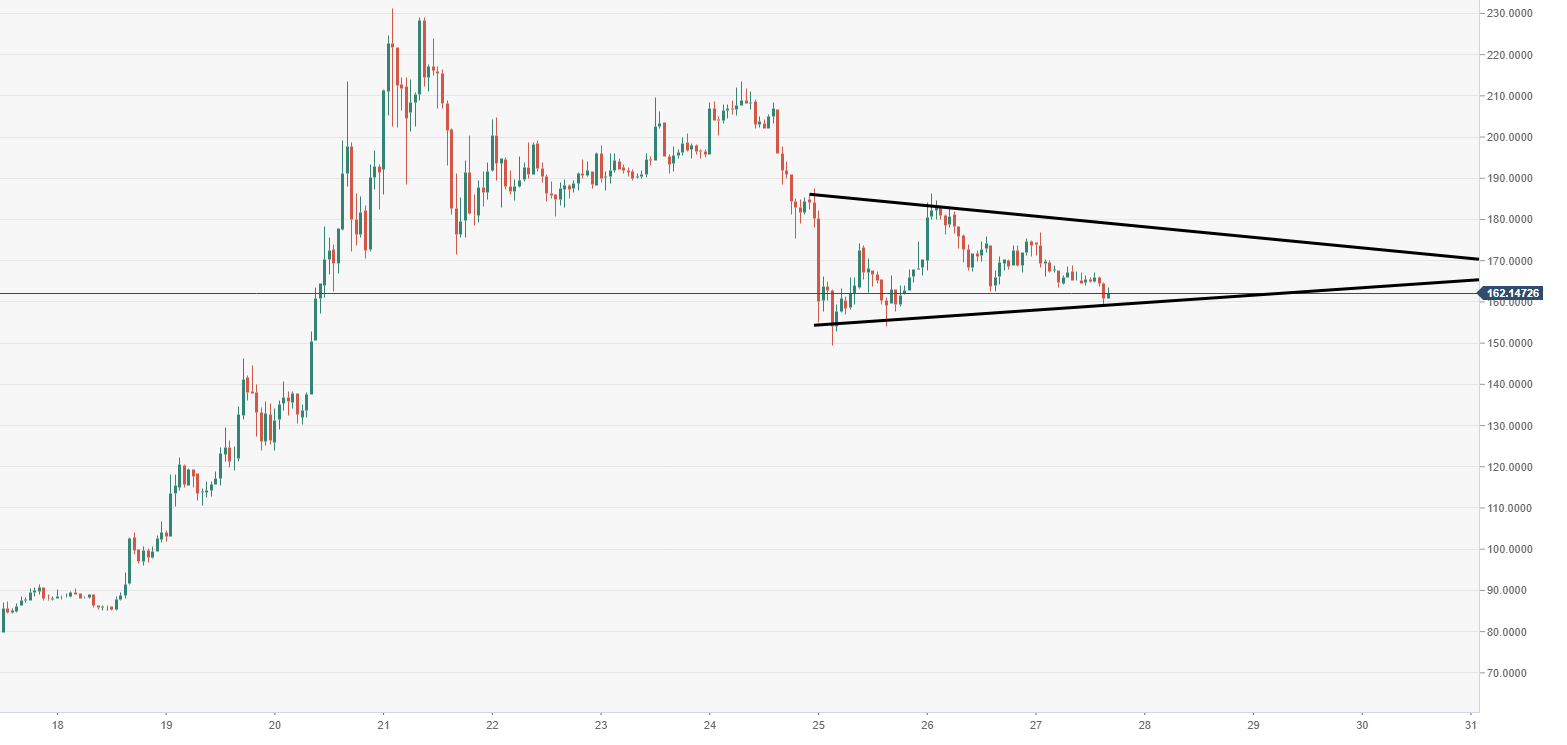
BCH/USD daily chart
- Price action is narrowing within a large triangular pattern, subject to an imminent breakout.
Author

Ken Chigbo
Independent Analyst
Ken has over 8 years exposure to the financial markets. He started his career as an analyst, covering a variety of asset classes; forex, fixed income, commodities and equities.


