- Bitcoin Cash taken a hit again from the market bears, dropping 3% on Tuesday.
- Bearish pennant pattern eyed for BCH/USD on the 30-minute chart view.
The Bitcoin Cash price hit on Tuesday with further losses down almost 3%, failing to make progression after the bounce off the lows on 10th June. A cooling in crypto prices remains evident across the board, with the major altcoins adding to their losses.
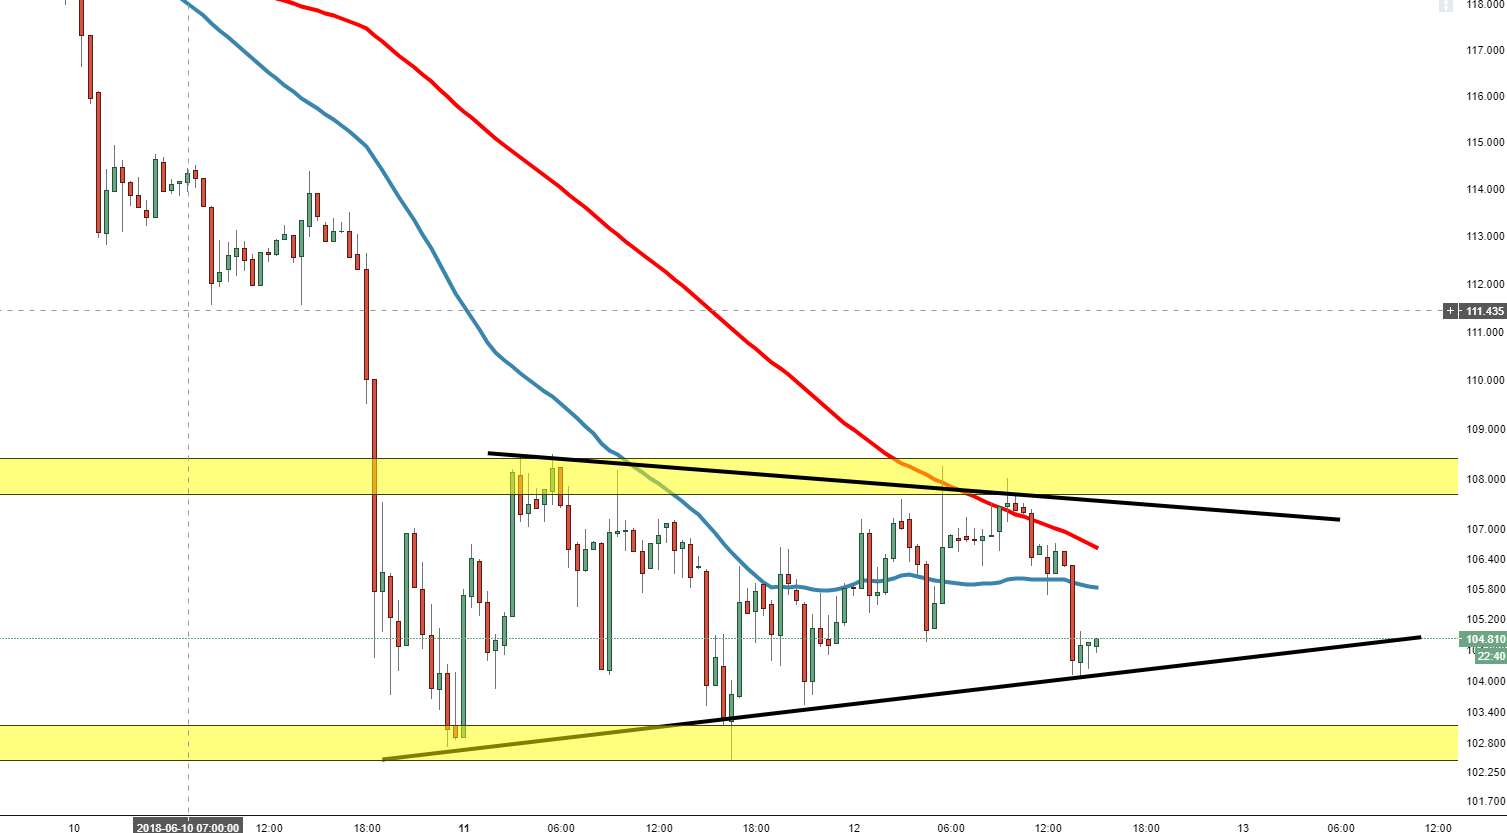
BCH/USD price action has become range over the past couple of sessions now, since the heavy bout of selling pressure hit the market. Recent price action has caused a bearish pennant pattern to form, which as going by the textbook, could be subject to a breakout lower.
Support in the near-term seen at $907.50 today’s (Tuesday) lows, which is the lower part of the bearish pennant pattern. A breach would see the demand zone come into play, between, $885-900. Resistance to the upside seen at $933 at the 50MA, $941, 100MA and then $950 the upper part of the pennant. All technical analysis mentioned is looking at the 30-minute chart.
BCH/USD 30-minute chart view
Note: All information on this page is subject to change. The use of this website constitutes acceptance of our user agreement. Please read our privacy policy and legal disclaimer. Opinions expressed at FXstreet.com are those of the individual authors and do not necessarily represent the opinion of FXstreet.com or its management. Risk Disclosure: Trading foreign exchange on margin carries a high level of risk, and may not be suitable for all investors. The high degree of leverage can work against you as well as for you. Before deciding to invest in foreign exchange you should carefully consider your investment objectives, level of experience, and risk appetite. The possibility exists that you could sustain a loss of some or all of your initial investment and therefore you should not invest money that you cannot afford to lose. You should be aware of all the risks associated with foreign exchange trading, and seek advice from an independent financial advisor if you have any doubts.
Recommended Content
Editors’ Picks
Ripple's move above this key level could trigger nearly 50% rally for XRP
Ripple has overcome a critical resistance level and flipped into a support floor on the weekly time frame. This development happened while XRP tightly consolidated for roughly 250 days. Investors can expect XRP to kickstart a massive rally.
Optimism price outlook with nearly $90 million worth of OP tokens flooding markets on Friday
Optimism volatility has shrunk in the ours leading to the network’s cliff unlock. It joins the likes of dYdX and Sui, which have similar events on their calendars. As token unlocks are often considered bearish catalysts, investors should brace for a reaction after the event.
Top 3 Price Prediction Bitcoin, Ethereum, Ripple: Retail watches from the sidelines with a bias for shorts
Bitcoin could clear $73,777 peak as BTC bulls resurface. Ethereum might fall 10% before next leg up as ETH RSI teases with sell signal. XRP could lose $0.6000 threshold as Ripple bulls fail to show up.
Jito price could hit $6 as JTO coils up inside this bullish pattern
Jito price action shows a potential cup and handle formation. Based on theoretical measurement rules, a successful breakout could yield a 56% rally to $6.0. A breakdown of the $3.86 support level would create a lower low for JTO and invalidate the bullish thesis.
Bitcoin: BTC may have recovered, but is it out of the woods?
Bitcoin’s (BTC) upward momentum has shown a significant decline for the past two weeks or so. This development led to a bearish signal on the weekly and an uncertain outlook on the monthly.