Bitcoin Cash Price Prediction: BCH targets 52-week high as on-chain data indicate room for growth
- Bitcoin Cash edges higher by 2%, extending the 6% surge from Wednesday within a rising channel pattern.
- MVRV data show room for growth before BCH hits a historic reversal level.
- Bitcoin Cash Open Interest jumps over 7%, indicating a surge in optimism.

Bitcoin Cash (BCH) is trading in the green by 2% at press time on Thursday, following a 6.39% price surge on Wednesday. Rising in a parallel channel pattern, BCH shows signs of increasing bullish momentum and nearing the $500 psychological level. Furthermore, the MVRV on-chain data suggests room for growth before reaching a critical level that has led to previous reversals.
On-chain data indicate fuel in the tank for Bitcoin Cash rally
Santiment’s Market Value to Realized Value (MVRV) indicator on a weekly timeframe suggests potential for Bitcoin Cash to extend its uptrend. The MVRV indicator calculates the average profit or loss of Bitcoin Cash investors. A higher ratio indicates a greater number of investors in profit, which projects a risk of profit booking.
Currently, the MVRV ratio stands at 0.665, whereas a ratio of 0.729 has led to profit bookings in Bitcoin Cash, as seen in March and May 2024. Thus, a potential space for upside movement is available before investors start to book profits.
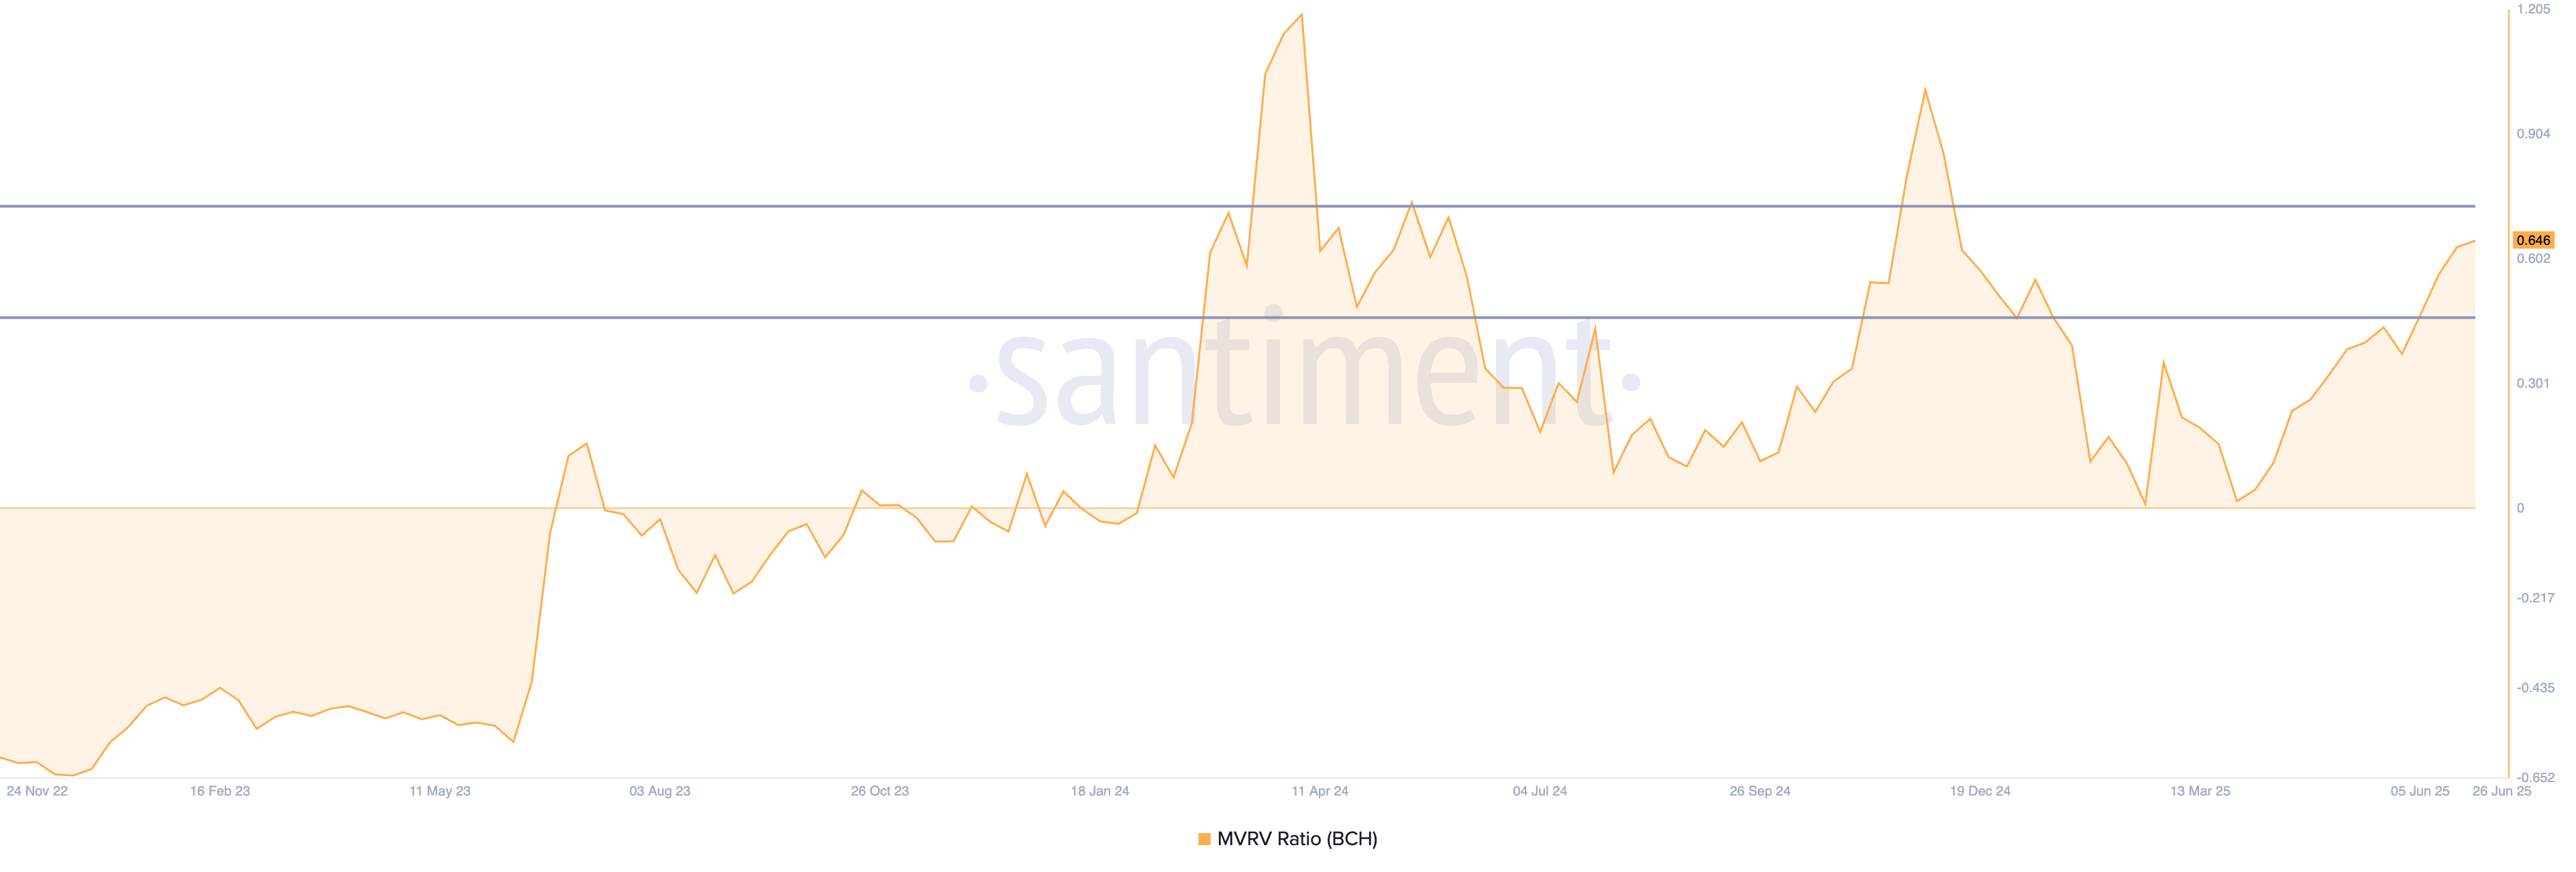
Bitcoin Cash MVRV data. Source: Santiment
It is worth noting that a spike above 0.729 could reach the December 2024 peak of 1.01, further boosting investors' profits.
Derivatives traders anticipate an extended rally
CoinGlass’s data shows that Bitcoin Cash Open Interest (OI) reached $471.99 million, with a 7.85% increase in the last 24 hours. An OI spike refers to an increase in funds inflow in the derivatives market resulting from excessive buying activity.
Adding credence to the bullish outlook, the OI-weighted funding rate turns positive to 0.0014% as call purchases outpace short acquisitions. Funding rates, when positive, are imposed on bulls to offset spot and swap imbalances resulting from heightened futures buying.
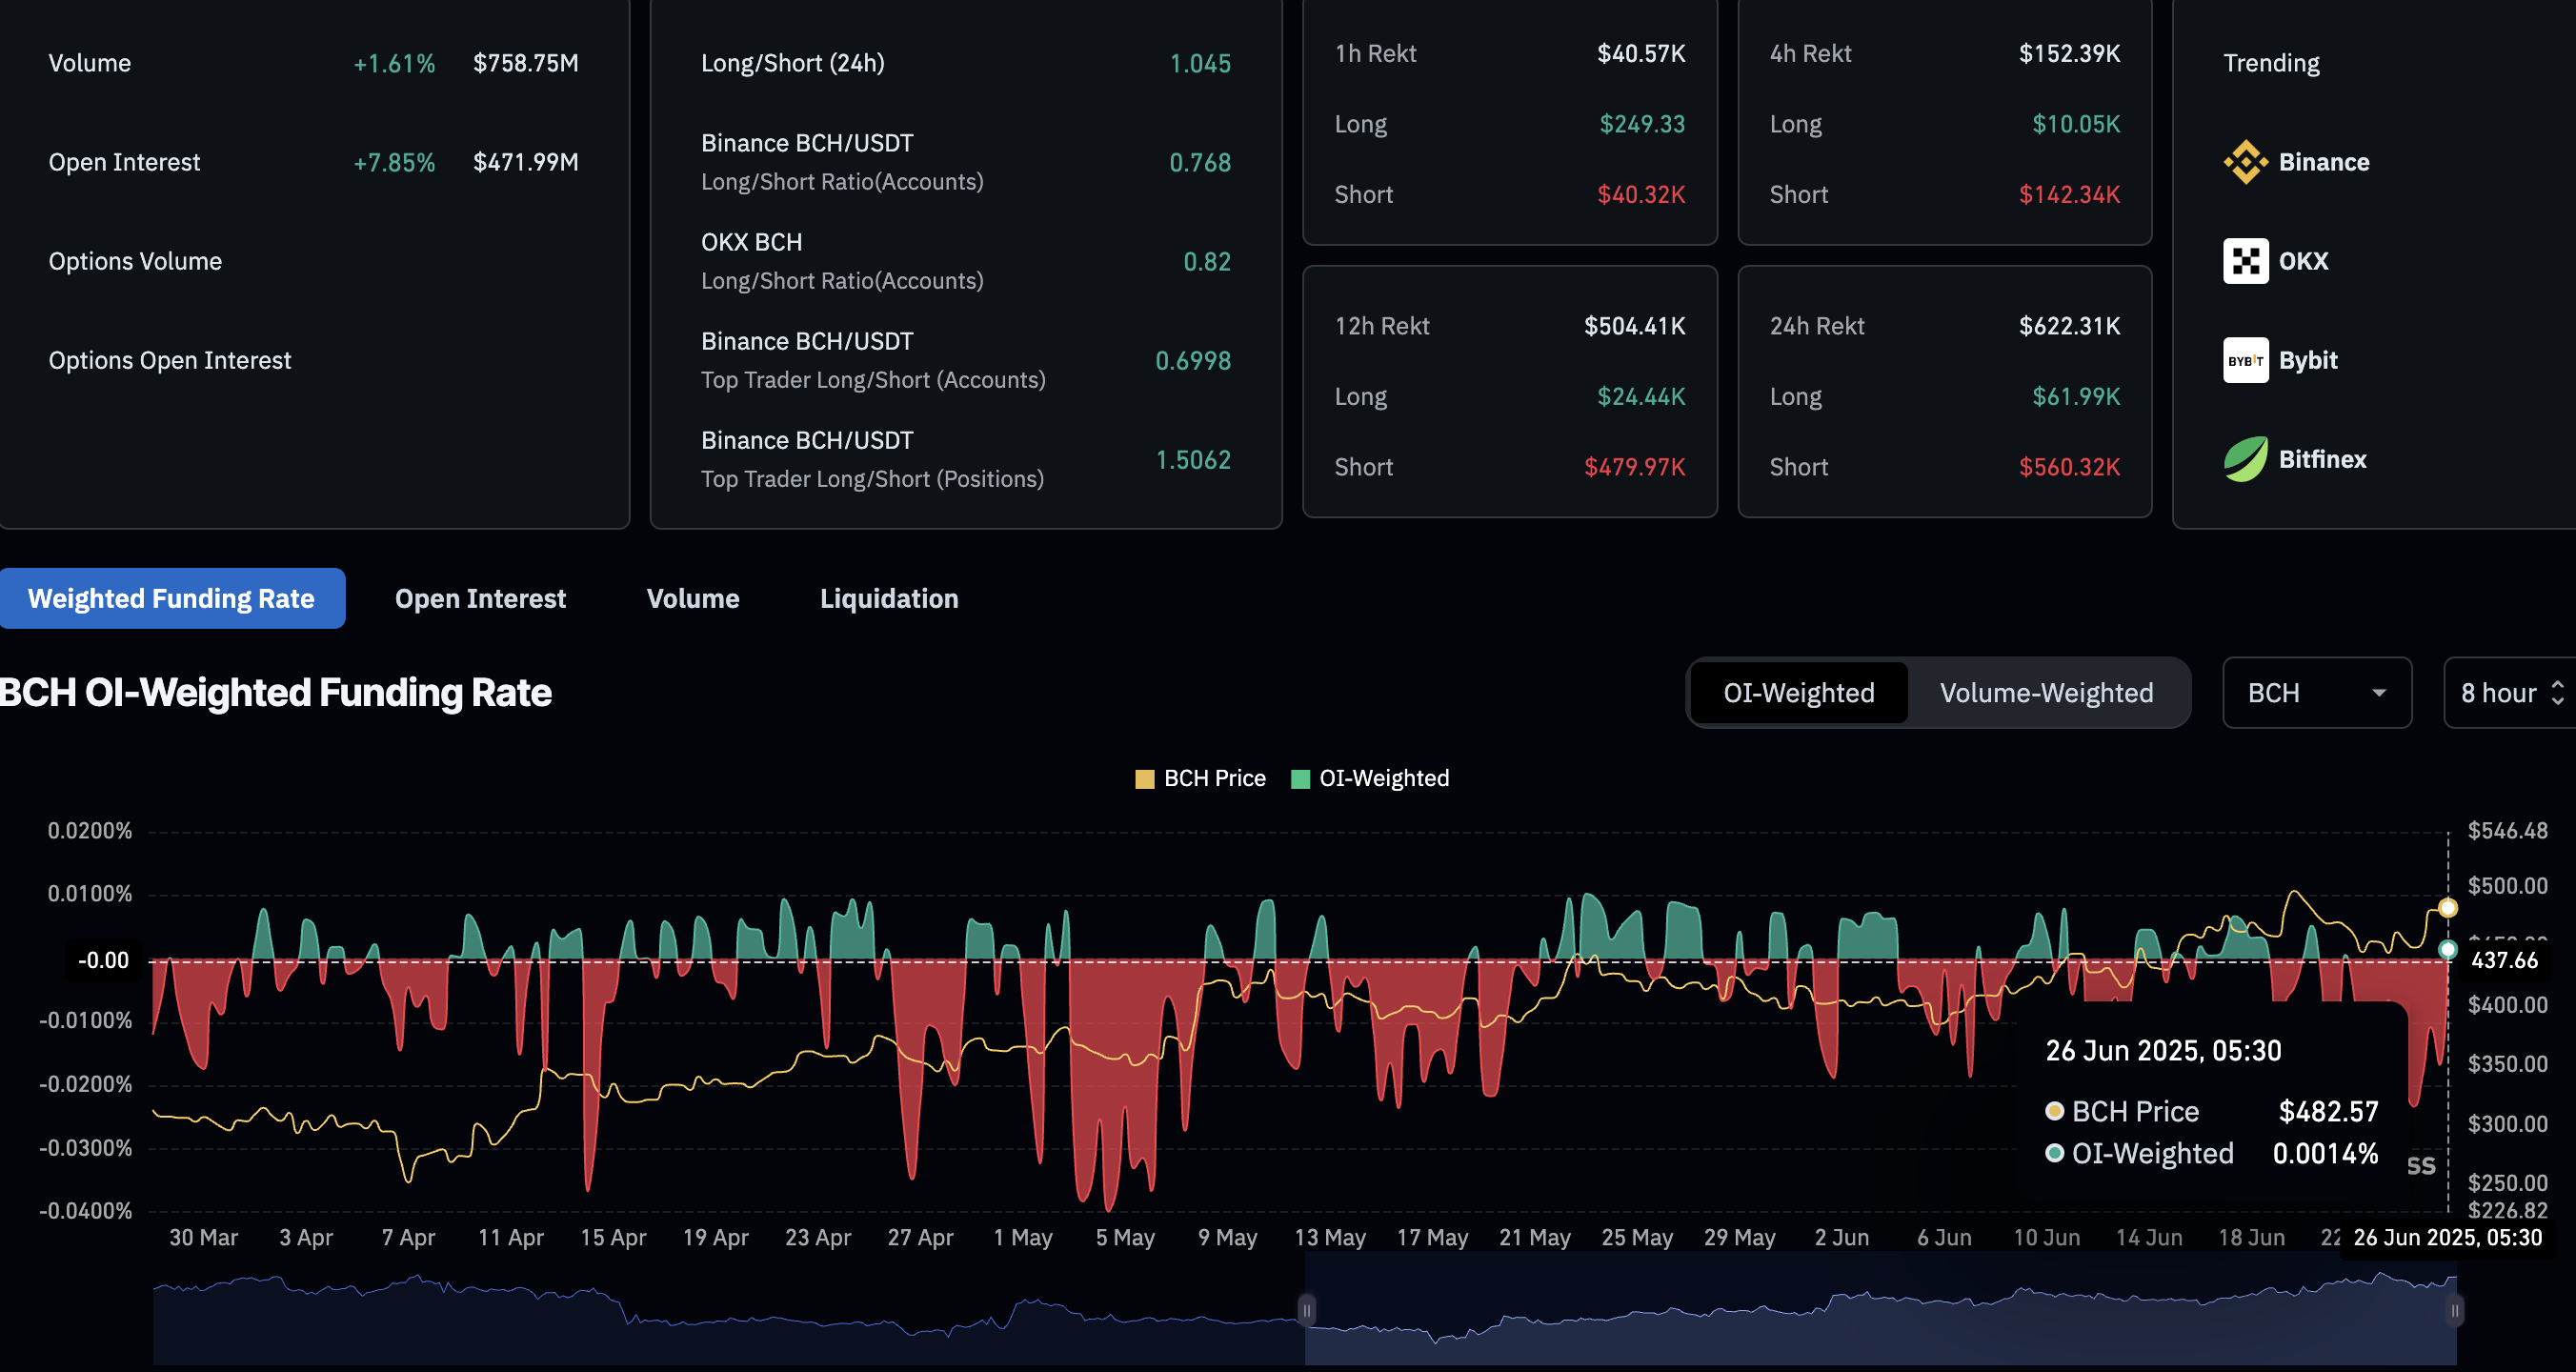
Bitcoin Cash derivatives data. Source: Coinglass
Bitcoin Cash nears rising channel breakout
Bitcoin Cash prints its second consecutive bullish candle, gaining 2% at press time on Thursday. BCH approaches the year-to-date high of $505, close to an ascending trendline formed by the peaks on May 10, May 23, and June 19.
The swing lows in Bitcoin Cash on April 16, May 5, May 30, and June 22 connect to form a parallel support trendline, resulting in a rising channel pattern. Typically, the pattern indicates an extension in an uptrend.
The intraday growth in BCH surpasses the 61.8% Fibonacci retracement level at $490, which is drawn from the 52-week high of $640 to the year-to-date low of $249. A closing above the overhead trendline could extend the recovery towards the 78.6% Fibonacci level at $556.
As the weekly MVRV data shows room for growth, investors could witness an extension towards the 52-week high.
The Moving Average Convergence/Divergence (MACD) indicator avoids crossing under its signal line, suggesting a revival in bullish strength.
The Relative Strength Index (RSI) is at 64, indicating an upside bias as it remains above the halfway line with an early reversal.
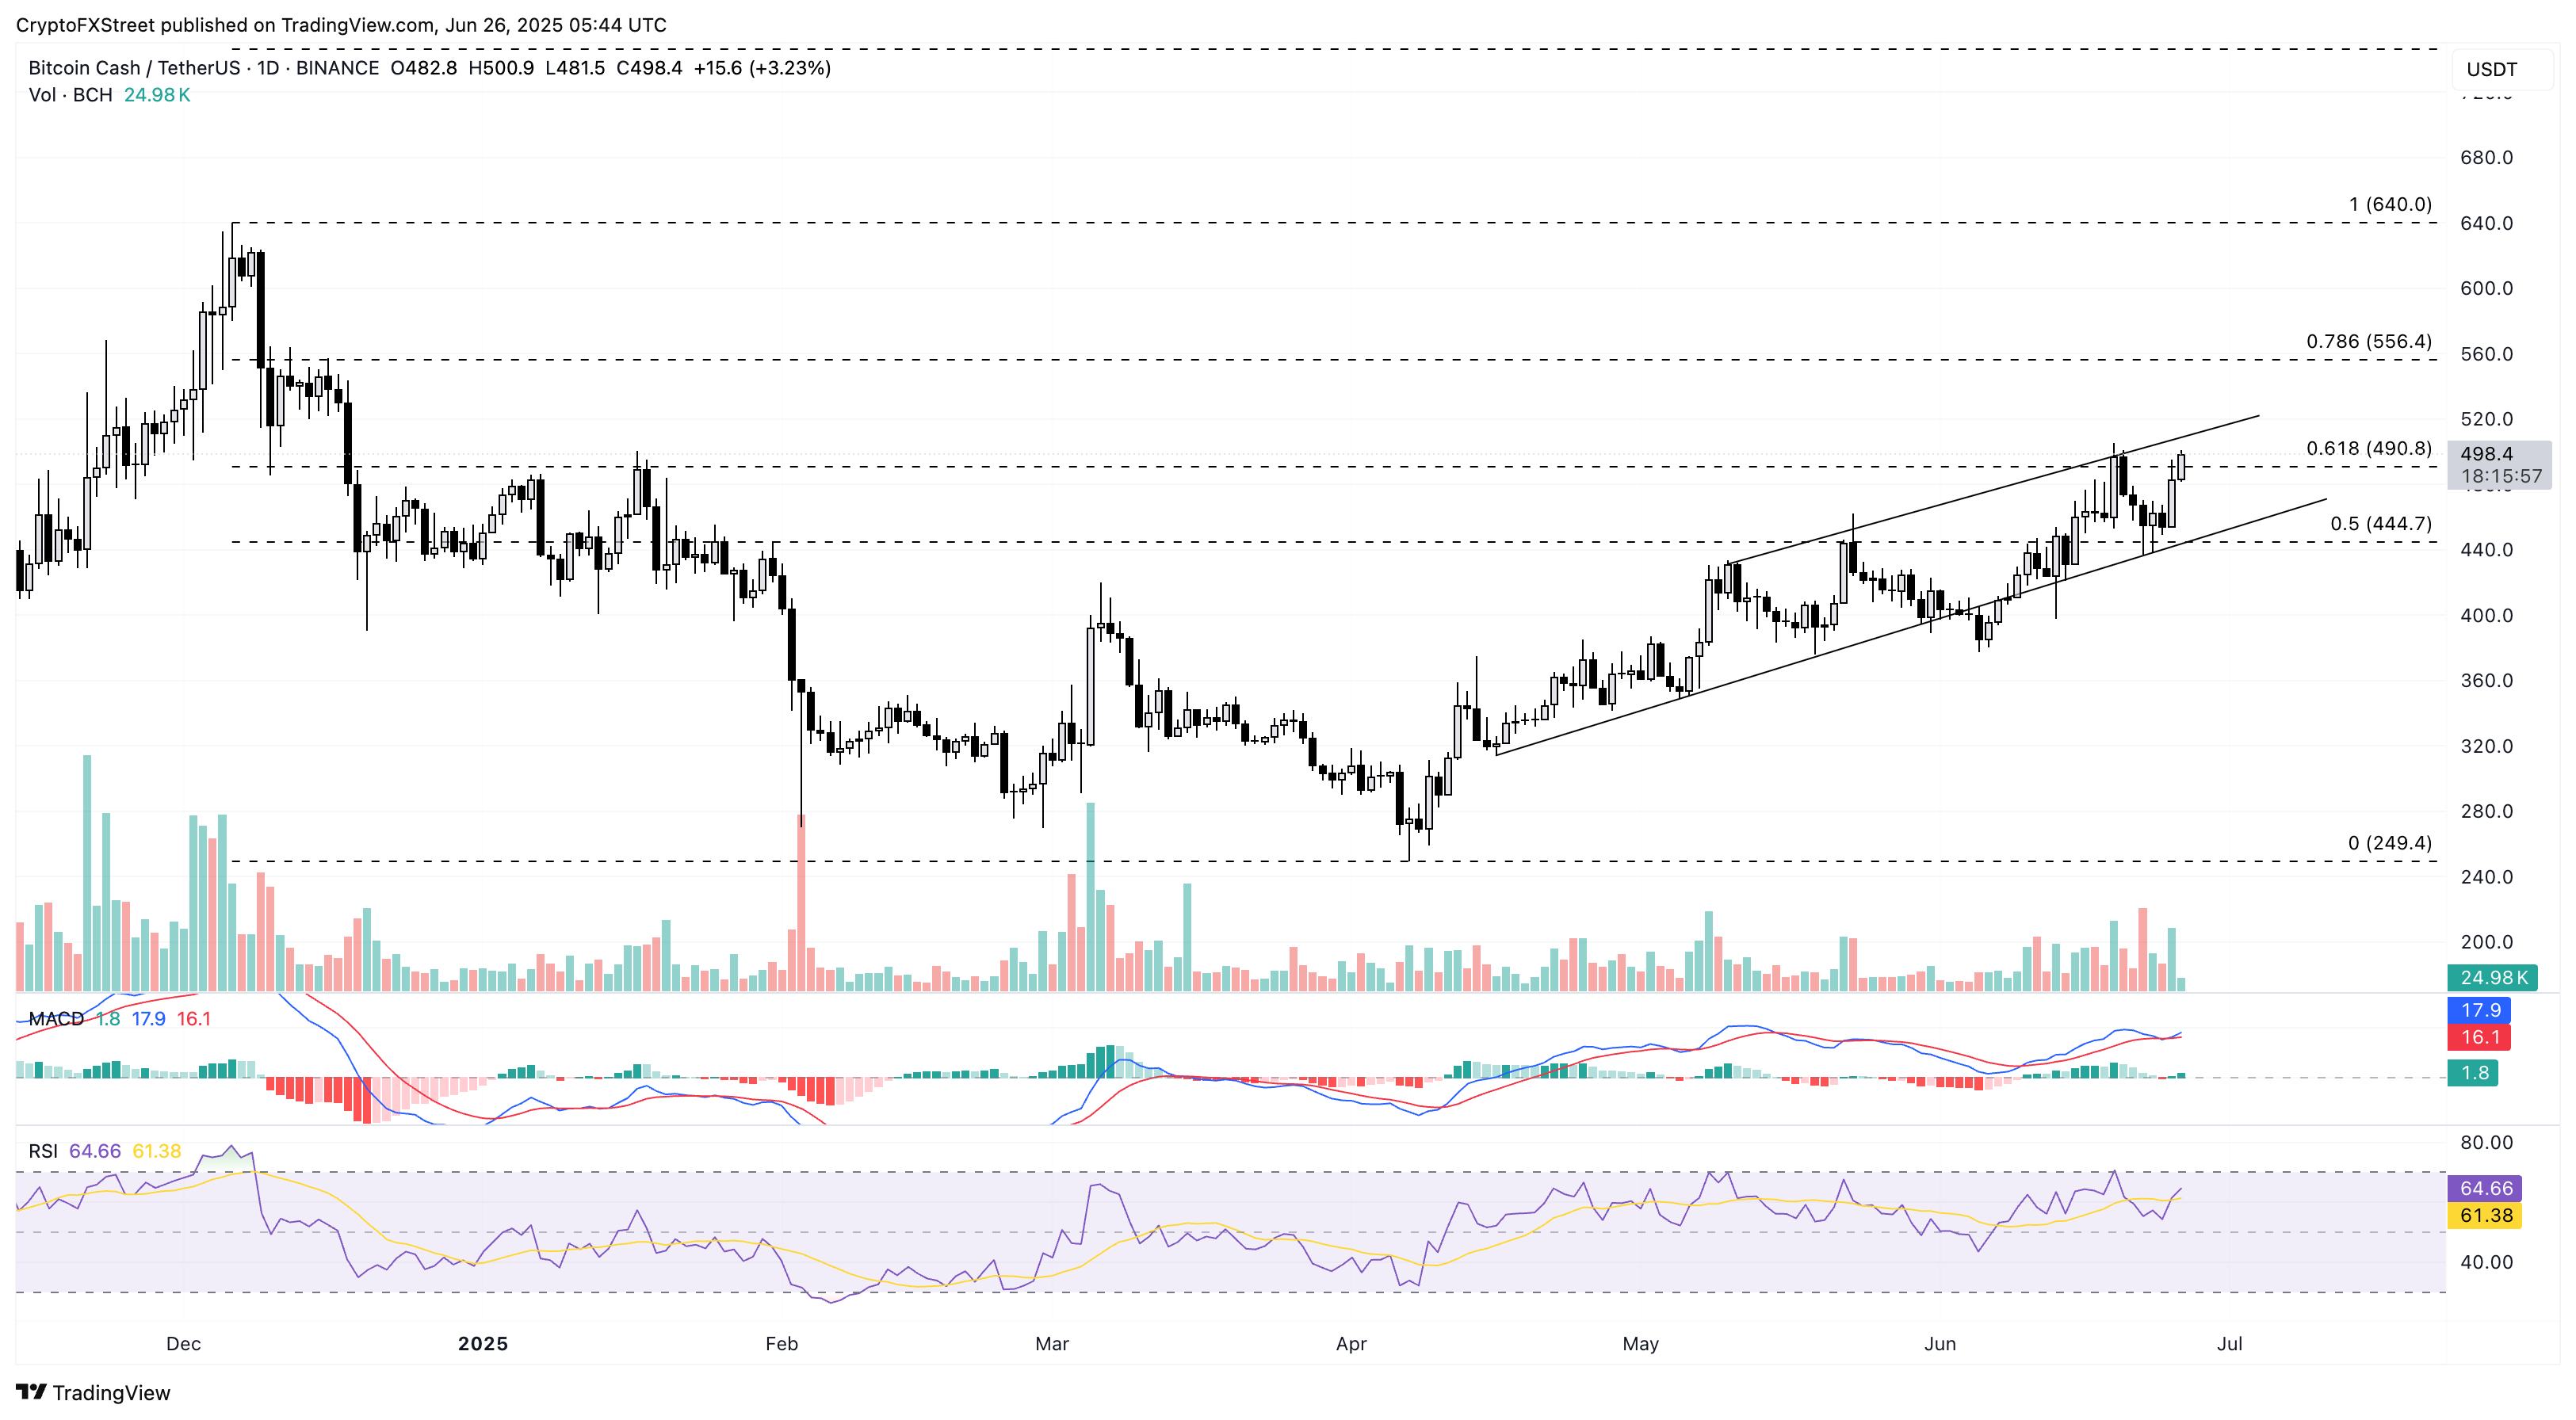
BCH/USDT daily price chart.
If Bitcoin Cash fails to close above the 61.8% Fibonacci level at $490, it could retest the rising channel’s lower boundary line at $450.
Author

Vishal Dixit
FXStreet
Vishal Dixit holds a B.Sc. in Chemistry from Wilson College but found his true calling in the world of crypto.